| 00:00 |
- We're back today and we're in a 2007 Dodge Ram, this is a 2500 with a Cummins, 5.9 litre and this is more of a performance oriented truck.
|
| 00:09 |
The reason we chose this truck today is because I want to get my hands dirty and I want to show you guys what it's like to be on the dyno to do your first tuning session.
|
| 00:18 |
So we've gone over the fundamentals, we've talked about what the class is about, we've talked about some of the tools of the trade, how to use those tools and what those are about.
|
| 00:26 |
This is your day one, you're in the truck, this is where the anxiety, the butterflies come.
|
| 00:30 |
Customers are going to bring trucks to you, they're going to have high expectations, it's important you keep your cool, it's important you take a fundamental approach and start from scratch and work your way up until you feel comfortable.
|
| 00:42 |
So this truck specifically, it's got a built motor, I think the customer previously cracked a piston or had some issue with it, anyway so the motor's in good shape, it's got connecting rods, head studs, all those goodies.
|
| 00:54 |
We have 100% Over injectors from Exergy Engineering so it's a reputable injector, they're capable of flowing twice as much fuel per given pulse width at high pressure.
|
| 01:02 |
We also have a upgraded turbocharger, courtesy of Calibrated Power.
|
| 01:07 |
A Stealth 67, so the stock turbocharger, this turbocharger looks very similar to that turbocharger however it has a 67 mm compressor wheel and a larger turbine wheel as well so it's going to be able to supply quite a bit more air to the engine to compliment the extra fuel that we're going to see from those 100% Over injectors.
|
| 01:26 |
Truck has a built transmission, has some gauges, has an Edge CTS but doesn't really have a whole lot of instrumentation on it.
|
| 01:33 |
The reason I chose this truck was because it's not a fully instrumented truck, it's very similar to what you're going to see tuning in your first performance truck, you're probably not going to have air/fuel ratio gauge on the truck, you might have an EGT probe but it might be independent, it might be on the CTS or it might be a pod style gauge.
|
| 01:51 |
So you're going to have to use your intuition a little bit, you're going to have to read the log file and be able to understand certain fuel rates, how happy the turbocharger is performing where it's at, how hard you're pushing the truck without seeing every single gauge that you'd like to see.
|
| 02:08 |
And we'll talk about how to do some of that today.
|
| 02:09 |
Really what it boils down to is starting with the basics and incrementally moving up so that you have a good feel for the platform as you move through the mod process and as you move through the tune process.
|
| 02:19 |
With all that said, let's get a baseline of the truck, I have it strapped down to the dyno, we're just going to run it with the stock fuelling tune file.
|
| 02:25 |
Has a couple of little adjustments made for the 10 mm pump that's on it but otherwise the truck's pretty much ready to run as is.
|
| 02:33 |
Timing's low, the boost is low, the fuelling's low, it's all just basics.
|
| 02:37 |
Keep in mind these trucks make about 295 horsepower to the tyre factory, With the mods that are on the truck, I'd expect almost twice that.
|
| 02:45 |
However the setup is definitely not optimised so we haven't changed anything really to take advantage of those other variables that we've added, or that the customer's added.
|
| 02:53 |
So we'll see how close we can get to doubling that 295 on this first pass and then from there we'll start making modifications and testing those.
|
| 03:00 |
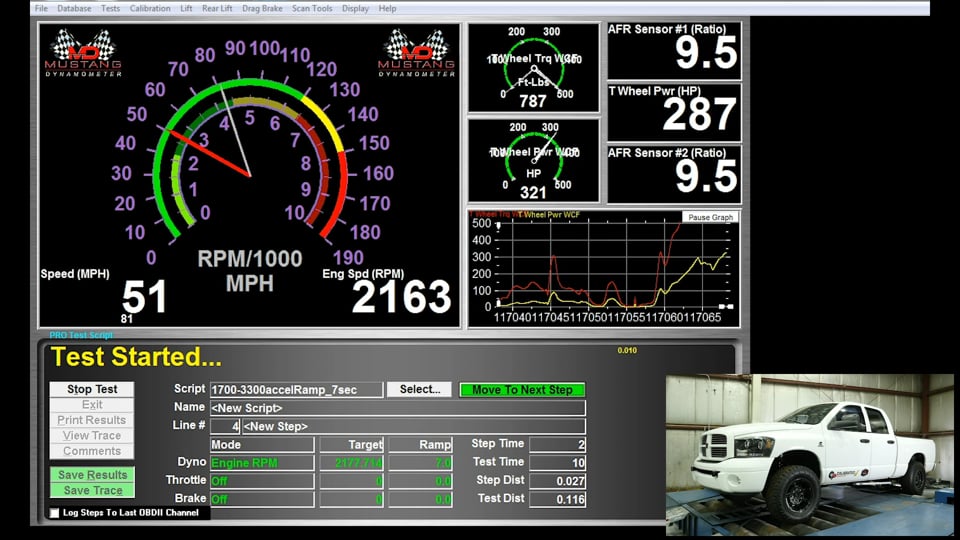
I've started the truck, it's running in park.
|
| 03:02 |
Couple of words of wisdom before we do our first dyno pass.
|
| 03:05 |
Really important that we use the operating range of the engine for our dyno run.
|
| 03:09 |
In this test we're going to run 1700 RPM to 3300 RPM and we're going to start under full load, so I'm going to bring the truck to full load before I let it loose and run a seven second sweep.
|
| 03:18 |
After that sweep, we'll pull up the graph and take a look at it.
|
| 03:20 |
All testing is done with the torque converter clutch locked in third gear at the same engine coolant temp back to back.
|
| 03:27 |
So I want to make sure my results are consistent so as I'm comparing those changes, if I'm seeing subtle changes I want to make sure that I'm picking those up.
|
| 03:33 |
So here we go, we're going to start our data log so that we can review the data.
|
| 03:37 |
There we go we're in drive, I'm going to flip the torque converter clutch lockup switch, feel it lock up.
|
| 03:42 |
I'll bring the truck against the brake, full throttle.
|
| 03:47 |
And let it go.
|
| 03:58 |
OK the test is over, I'm not going to touch the brake, I'm just going to turn off the torque converter clutch lockup switch, I'm going to end my log by pressing cancel.
|
| 04:14 |
I'll let the truck come back to idle, let things cool down, turn off the fans then we'll review the dyno.
|
| 04:19 |
We've made our dyno pull and we have the number.
|
| 04:22 |
So the number's 527 horsepower, not too bad, about 980 foot pounds of torque.
|
| 04:28 |
We saw the peak right around 2850.
|
| 04:31 |
So if you look at the shape of the graph, there's some telling things going on here.
|
| 04:37 |
Just want to draw your attention, one to the peak.
|
| 04:40 |
So the peak as you can see here on the dyno, both peak torque and peak power happened about the same RPM, that's very unusual for a diesel.
|
| 04:47 |
Usually peak torque in a performance diesel application is much sooner than peak horsepower.
|
| 04:52 |
Usually we see peak power around 2900, 3000 RPM, maybe even a little higher and peak torque will be down near the start of the pull around 1700 or 1800 RPM.
|
| 05:00 |
So we want to check the tune out and check the log file out for that stuff especially.
|
| 05:04 |
At the start of the pull, power was down quite a bit and then we had a steep slope right around 2400 RPM, steep slope from there up to 2850 and then another steep slope after that peak and that is interesting.
|
| 05:16 |
We would expect power to carry if it was based on hard part limitations or efficiencies of the engine, expect power to carry out a little further than that however the fact that power dips off very quickly at the end of the pass is kind of telling that it's probably an electronic limiter, we'll look into that shortly here.
|
| 05:34 |
So let's jump from the dyno to the log file.
|
| 05:36 |
This is where you're going to really start to learn.
|
| 05:38 |
Let me show you where I start on a log file.
|
| 05:40 |
So as I'm reviewing a performance dyno pull, the first thing I'm going to look at is throttle position, throttle position can be seen here, as the blue line we can see this blue line hangs out up at 100% and then right about here where the orange line starts to make a ramp up, that's when I let the truck go and it runs up the ramp of the dyno pull.
|
| 05:57 |
So as the orange line is running upward, that's RPM gaining, throttle position's staying the same, pink line mile an hour, and the green line gear, we're always in third gear.
|
| 06:06 |
So I'm going to go down to the second area here and I'm going to look at this next orange line, this next orange line is one of the most important lines in the graph and that is the fuelling number so that's the fuelling call.
|
| 06:14 |
127.5 mm³ and that mm³ is important because most of the lookups in the tune are based off of mm³, cubic millimetres and that's the quantity of fuel that gets injected per stroke per cylinder, so per power stroke, per cylinder, that's the quantity of fuel, very minute, very small quantity of fuel but it needs to be measured well and then once I see that fuel quantity going up towards the peak, I can tell the truck is under power, it's commanding the fuel that it wants.
|
| 06:43 |
OK so we're up near 130, 127 mm³, I'm going to go to the start of my run which is where the RPM starts to slant up and I can just follow my fuelling number from there.
|
| 06:52 |
127 and I can make a mental note, up to 145.5 mm³ and then shortly after that, I'll draw your attention back to this orange line and this orange line quickly tapers off and we can see that similarly in the dyno graph as the power quickly tapers off after peak.
|
| 07:07 |
The next line here that I have up is the pink line, the pink line is wastegate duty cycle.
|
| 07:11 |
This truck is going to be trying to maintain boost control using a pulse width modulated wastegate on the 2004.5 to 2007 RAMs, there's electronic control in the wastegate.
|
| 07:23 |
It's pretty archaic design but it works and any time you see that the wastegate control is moving, it's the pulse width modulated wastegate trying to control boost pressure.
|
| 07:33 |
So under full load I can see the pink number here and that pink number shows 47% wastegate duty cycle.
|
| 07:38 |
That duty cycle hangs out for a little while and then as the truck really comes into power and heads up towards the peak power number you can see that wastegate duty cycle drop off to 0%, so zero would be full active meaning the truck wants the wastegate to see the full wastegate signal and get rid of the boost, open the wastegate, too much boost.
|
| 07:57 |
How do we know, well we're looking at the green line and this green trace is the boost pressure.
|
| 08:01 |
So you can see at light it's two psi, under heavy load right before the run it's 26 psi and then as we ascend the run, we see a peak of 45 psi at 3000 RPM.
|
| 08:12 |
We'll take note of that because we'll certainly be adjusting boost pressure later as we attempt to make more power on this truck.
|
| 08:18 |
Next I want to draw your attention to the orange line, that's main injection timing.
|
| 08:21 |
That main injection timing number is fairly low so at the start of the run we're at -7°, typically we see positive timing numbers in performance applications.
|
| 08:31 |
A lot of times on factory trucks you'll see negative timing numbers to mitigate noise and vibration and harshness and also to control NOx emissions.
|
| 08:40 |
So we want to take a look at timing, that's one of the things we're going to affect as we move through the tuning process on this truck.
|
| 08:46 |
At the start of the run, -6, -7, as we go up the run, 8° peak timing, 9°, 8° and then back down as we down the backside of the run.
|
| 08:58 |
Other things I have in this cell, engine coolant temperature, inlet air temperature, pilot injection quantity, nothing really major, the engine coolant temp, I usually just have up to make sure that I'm consistent run to run, same with the inlet air temp so if I have widely different power numbers run to run, I can go back and compare those runs and say OK was the coolant temp 135 at the start compared to 180 at the start of the other one? Or the inlet air temp, maybe the truck was really sitting heat soaked for a while before it got a chance to run.
|
| 09:26 |
As i go down here to the bottom block, the bottom block is all about fuel control for me, so I want to look at the duty cycle on the regulator at the pump, I want to see is the pump running at capacity, is the fuel pressure actual chasing the fuel pressure desired? So that's these green and red lines.
|
| 09:41 |
These should be right on top of each other or very near each other.
|
| 09:44 |
The pink line is fuel pressure desired and the green line is fuel pressure actual, you can see a little hiccup there, that's nothing to be concerned about and then a peak fuel pressure of 23208 psi and we're getting 23293.
|
| 09:57 |
Usually any time we see fuel pressure within 1000 psi of call, everything's OK.
|
| 10:01 |
The milliamps, that's just to show me how hard the pump is working, same with the duty cycle.
|
| 10:06 |
So we have a pretty good idea of what's going on based on the log file here, we've got a nice review, it's really nice to ground yourself by running a low power test first.
|
| 10:14 |
This truck is capable of making 800 plus rear wheel horsepower, we've done it in the past but to run it at 500 horsepower in a very stockish fuelling setup, and just see how the systems are working and see how happy the truck is, see how happy the pump is, see how the fuel pressure actual's keeping up with fuel pressure desired, see what the boost pressure numbers are and see the shape of the fuelling curve as it compares to the dyno chart, that tells me a lot about the health of the truck, if it's ready to go on and make more power.
|
| 10:41 |
OK so I'm ready to make more power, let's go in the tune, let's look around a little bit, there's certainly more to the tune than I can cover in this short demo but I just want to draw your attention to some basic tables that are in the tune file that are designed to help you make power.
|
| 10:51 |
This truck is equipped with a five position switchable tune, it has 5 subsets of tables here, I'm just going to be working in program one.
|
| 10:57 |
So usually when I'm teaching these classes, it's guys who have started out with gas tuning or have a history in tuning gas engines and they want to jump to timing, they want to jump to air/fuel ratio to make changes, to make adjustments.
|
| 11:09 |
So I'm not opposed to that, we can make some small changes and see what they, see how the truck comes up.
|
| 11:15 |
One of the first and the easiest changes we can look at is the timing table.
|
| 11:19 |
Timing table will show us a few things.
|
| 11:21 |
Most of the tables in this tune are laid out similar to this timing table.
|
| 11:24 |
I'll take a second and show you how this table's laid out and what it means.
|
| 11:27 |
On the top of the table, you'll see the mm³ numbers.
|
| 11:30 |
Most of the timing numbers and fuel pressure numbers are based off of mm³ and mm³ is simply fuel rate like I stated before.
|
| 11:38 |
Zero would be in deceleration fuel cutoff where the truck is off.
|
| 11:41 |
10 would be close to idle and 140+ would be full fuel or truck is trying to make as much torque as it possibly can and be injecting as much fuel as it possibly could.
|
| 11:51 |
On the left side we see RPM.
|
| 11:53 |
As RPM increases you can see the timing numbers tend to increase as well.
|
| 11:57 |
This timing curve probably looks a lot different than anything you're used to if you're coming from the gas world.
|
| 12:02 |
It's not uncommon to see negative timing numbers in the idle region.
|
| 12:05 |
It's also not uncommon to see negative timing numbers in the cruise region.
|
| 12:08 |
The bottom right hand corner of the graph is what I'd call the power region.
|
| 12:11 |
So higher RPM and higher fuel rates and that's the area that we're going to be paying close attention to in this lesson.
|
| 12:18 |
Again this is a very basic demo but let me just show you some of the tools that are available to your disposal.
|
| 12:23 |
So we saw in the log file, that we were making 8-9° of timing at peak power at 2850 RPM close to 3000 RPM in that range.
|
| 12:33 |
And you can see that similarly in the tune file here.
|
| 12:35 |
So we were at 140 mm³ and we were at 2900 RPM.
|
| 12:39 |
There we go, 9° of timing, easy enough.
|
| 12:42 |
A lot of beginners in the performance tuning on the diesel side like to use a timing calculator, helps you kind of do a sanity check on are my numbers reasonable? So let's do a quick adjustment to the timing table and then we'll flash those changes in and see what those changes make as far as power on the dyno.
|
| 12:59 |
So EFI Live allows you to use a timing calculator on the '06 Dodge.
|
| 13:03 |
I click the timing calculator here to open that up.
|
| 13:06 |
What that timing calculator is, it's going to show you what percentage of injection happens before top dead centre, commonly 50% before, 50% after, if you're in boost is a very very basic rule of thumb.
|
| 13:21 |
I like to err on the lower side of that, especially if you're out of boost, you'll want to be on the much lower side of that.
|
| 13:26 |
We can see at peak power here, we're at 26% of injection happens before top dead centre.
|
| 13:32 |
With the larger injectors in these trucks, in this truck especially we're 100% over injectors, extra timing should help us out here.
|
| 13:38 |
So because I have this calculator I have the option to simply select a test window I'm working in, which is high fuel, I think we started at 127 mm³ so I'll click down over here at 1700 RPM, I'll kind of select this whole area.
|
| 13:51 |
And then I can select what percentage of injection I want to happen before top dead centre.
|
| 13:56 |
35's a pretty safe number and that's, when I say safe I mean usually for higher RPM.
|
| 14:02 |
Now this is not taking into consideration any noise constraints of NOx emissions of anything like that, this is strictly power in a competion scenario.
|
| 14:09 |
And then I'm going to blend this in, so EFI Live has some nice tools, HP Tuners does, a lot of the big name softwares out there have some really nice tools as far as blending go.
|
| 14:18 |
So easy way to blend is to highlight those cells, I can come up here and fill cells with linear data and that'll just slope that change in and then similarly I can slope that change in in a linear fashion.
|
| 14:35 |
When I think I'm close I can click apply and I can close the calculator and I can look at my new timing graph.
|
| 14:42 |
I right click on the map I can drag it around and kind of show you what I made, nice and pretty.
|
| 14:47 |
Easy thing to do here if I don't, I think it's a little bit steep, I'm going to make a few adjustments, so there's some smoothing tools.
|
| 14:52 |
This is stuff that you can get into to refine your tune a little bit.
|
| 14:55 |
This isn't stuff I would do first day on the dyno but just to show you kind of what's out there a little bit and as a matter of habit of operation I'll smooth this in a little bit.
|
| 15:03 |
So here's the smoother, I click it and you can see the cells smooth in and the data comes in a little bit cleaner.
|
| 15:10 |
So now that I have that data in there and smoothed, I'm going to make sure that that timing number goes into the other timing tables so there's four base timing tables, you might not be 100% sure which your truck is running in, shotgun approach would say to change 'em all unless you narrow down which one you're in.
|
| 15:25 |
So 110 mm³ and 1550 RPM I'll press control V, paste, there's my timing adjustment and you can see there that table was different, I'm going to back that change out so this air density adjust number two, the timing was at 11.5° so we know we weren't running an air density adjust two and I'll just blend that table in a little bit, 11.5°, similar we weren't running in timing adjust three, I'm going to blend that in a little bit, show you a couple of different tools at your disposal.
|
| 15:52 |
Again this is kind of a quick and dirty method but it will certainly add some timing.
|
| 15:56 |
So we've added timing instead of 9° we're going to go to about 12.6° at full throttle and we're going to see more timing in earlier in the rev range as well so as I go up on the left hand column, I go from 3000 RPM up, back to the start of our test, 1550, 1700 RPM.
|
| 16:16 |
So I'm going to save this tune, I'm going to reflash it and then we're going to run the truck on the dyno, verifying the log that we got the extra timing and see what kind of power gains we get.
|
| 16:25 |
So we've run that second test, we're going to find out whether or not that extra timing made more power, made more torque or what impact it had on the power output of the truck, not the drivability yet, we're on the dyno still.
|
| 16:36 |
So before we do that, I just want to look at the log file and verify did we go from that 8,9° of timing up to the 12, 13° of timing and let's see in the log file that that actually happened.
|
| 16:47 |
So here's the old log, just to refresh our memory again, 8° of timing at 2916, right around there, OK.
|
| 16:54 |
I'm going to open the new log, I like to rename these so they make sense.
|
| 16:58 |
So I'm going to head to that same position in the log, I'm going to look and see, as RPM climbs towards the 2900, do we have 8° or 9°? So again I draw my attention to the orange line, I chase it up, 2926, and then I look down to the timing number and the timing number's at 12° so we did in fact gain 4° of timing at peak, we also gained some timing across the entire RPM range.
|
| 17:23 |
So let's divert our attention from the log file and let's look over and see how did that impact the dyno number? The first thing that grabs my attention in the dyno run is that the runs take off at the same power level, they're within a few horsepower of each other so it's a pretty consistent test.
|
| 17:38 |
The other thing I notice is that right after they take off the tune with more timing pulls ahead, 455 horsepower difference at about 2100 RPM, 414, so that's a 40 horsepower difference early in the rev range, that's significant, or 40 foot pounds, 331 power, 299 about 30 horsepower difference.
|
| 17:57 |
And you can see as the run changes, as we climb up the rev range there that that gap maintains a pretty consistent trail however those two lines converge and they converge right around 2650 RPM.
|
| 18:09 |
And at that convergence point, the interesting thing is that the horsepower number of the lower timing tune surpasses that of the higher timing tune.
|
| 18:18 |
Which tells me that the timing that we added after 2650 RPM was to the detriment of the output of the engine.
|
| 18:25 |
So we in fact made less power by adding timing up there.
|
| 18:28 |
Adding timing doesn't always gain power, guys who have been in the tuning business know that.
|
| 18:32 |
It's important to show that, the temptation in the performance diesel market is that more timing's going to make you more power.
|
| 18:36 |
You don't know that unless you test it and this dyno graph is a perfect indicator of that.
|
| 18:41 |
As we continue through we can see that the peak on the lower timing tune is actually higher, 527 compared to 517 so we lost 10 horsepower at the peak.
|
| 18:49 |
Torque wise though, the lower timing tune also made more torque, more peak torque but as I pull over to the average, which is going to be the driver experience, so when your'e running the truck and you're going up to the shift point, falling back down and pulling through the rev range again, the average of the dyno pulls is going to tell a much better story, much more accurate story of the driver experience than the peak numbers.
|
| 19:09 |
The tune with more timing made significantly more average power, 408 compared to 385.
|
| 19:13 |
So that's 23 more average horsepower through the pull.
|
| 19:17 |
That's going to show up on a time slip, that's going to show up 0-60, that's going to show up on the street.
|
| 19:21 |
The thing to take away from this is that we need to address those timing numbers in the window where we lost power compared to the stock timing tune and back those timing numbers back a little bit.
|
| 19:30 |
This is an iterative process, this is stuff that you learn on the dyno by looking at where those numbers diverge between, where you see those gains and where you see the losses.
|
| 19:40 |
And then mitigating those at the loss point to get the best out of the truck.
|
| 19:43 |
OK so we've talked a little bit about timing, however the big thing that I see in these dyno graphs is that we still have those sharp points, so the truck is down on torque until it comes up to 2850, makes a sharp peak and then quickly we lose horsepower.
|
| 19:55 |
Adding timing didn't really change that very much, we saw more torque down low, a slight rounding of the peak but also a quick dive right after the truck made peak torque and peak power.
|
| 20:06 |
So what gives? Well I'm doing to draw your attention to the tune file again and show you.
|
| 20:09 |
As the manufacturers build these tune files, they build what's called a lug curve.
|
| 20:12 |
And this lug curve defines the output of the engine across the RPM range.
|
| 20:16 |
This lug curve is designed to do a bunch of things, one is to control the output of the engine at different RPM to make sure that we're not getting excessive torque for a whole bunch of reasons so we don't break parts, overheat, have ran into emissions issues, all that stuff so we want to find the lug curve of the engine and see does that lug curve kind of translate into the shape of this dyno graph and if so, that'll tell us that the shape of the dyno graph is electronically limited.
|
| 20:41 |
Now here's a pro tip, we looked at the log file and we saw that peak fuel was 145 and that only happened at 2850 RPM.
|
| 20:48 |
With that peak fuel at 2850 and then quickly peak fuel tapered down into the 120s and below on the right hand side towards the higher RPM but as that peak fuel pulls off, you know OK for some reason the engine is not commanding full fuel rate.
|
| 21:03 |
Let's take a look here at a lug curve and I'll show you what I mean.
|
| 21:05 |
EFI Live has labelled these tables very helpfully, this 2006 platform's really a pretty easy platform to tune so here's the fuel limiter table selection two.
|
| 21:14 |
This is just one of the limiters, in most OEM tuning platforms you're going to find a lot of limiter tables and that's because there's a lot of different reasons why you'd want to limit the output of the engine.
|
| 21:23 |
Some of the aftermarket tuning platforms you're only going to find one or two limiters, however when you're on the OEM stuff, prepare to find 10 or 12 limiting tables.
|
| 21:30 |
Now this is interesting, our run starts at 1700 RPM, now we can see on the graph here, these numbers are, different columns represent different altitudes or different reasons for limiting.
|
| 21:42 |
I'm going to assume that the truck is in the higher column and I'm going to assume that because the evidence that I have in the log file shows that we're at very nearly 145 mm³ at peak fuelling and the zero column is the closest one to that number.
|
| 21:57 |
Remember on an OEM tune, things aren't always exact, you might be one or two or five mm³ off, it's not uncommon.
|
| 22:03 |
Some of that's accounted for in pilot and post injection.
|
| 22:06 |
So let's look at column zero and let's look at our dyno graph.
|
| 22:08 |
So this would define our power output or our torque output.
|
| 22:13 |
You can see at 1700 we have a slow ramp up to peak at 2850, 2900 and then boom a quick fall off after that.
|
| 22:21 |
That's pretty telling, that's very similar to the shape of our dyno graph.
|
| 22:24 |
In fact, I would say the two are just about identical twins.
|
| 22:28 |
So if I want to get full fuelling, I want to get full torque, I want to use all the fuel that I have available to me, what I need to do is tell the engine that it's OK to do that.
|
| 22:37 |
I'm going to tell it that by adjusting this curve.
|
| 22:39 |
So I'm going to look at the window where we're operating the truck, we want peak torque.
|
| 22:43 |
And that's from 1700 RPM up to essentially the redline and I'm going to type in that big fuelling number, 145.
|
| 22:49 |
And you can see I kind of plateaued that whole curve.
|
| 22:53 |
Now as you're tuning for street manners or you want to put a rev limiter in or you might have other aspirations, other reasons to limit, this would be where you would do that but for the sake of this demonstration I'm going to make it obvious, I'm going to use my mouse pointer now to kind of slope that curve in a little bit, make it look pretty, so we know now that we have that torque limiter out of the way.
|
| 23:11 |
And just because I'm not 100% sure that I'm not in column one, two, three or four, I'm going to go ahead and copy this limiter into those tables as well.
|
| 23:19 |
I'm just clicking at the top and pressing control V to paste.
|
| 23:22 |
There now you can see all the torque limiters are the same.
|
| 23:24 |
One of the other tables that I want to draw you to, just as an example of how the factory has many torque limiting tables, many things that can pull fuel away, I'll draw you to the factory pedal positon table.
|
| 23:33 |
Now this table across the top shows throttle positon versus RPM.
|
| 23:36 |
So RPM is on the side, as engine speed increases, this is the call for how much mm³ goes into each stroke or each power stroke.
|
| 23:44 |
So at 25% pedal position we're looking at 35 mm³, 50% we're looking at 70 mm³ and at 100% throttle position we're looking at 145 mm³ so full fuel.
|
| 23:55 |
I want to look right here at 3000 RPM, this is kind of interesting because instead of having 145 mm³ we have 131 and then at 3220 we have 100 mm³ so we have a quick plateau and a drop off that plateau as RPM crests past 3000.
|
| 24:10 |
Very similar to what we're seeing in our dyno graphs.
|
| 24:12 |
So in order to test the theory that this table is also contributing to the top end fall off power, I'm going to take that 145 row and I'm going to paste it into the rows below it.
|
| 24:22 |
I'm not going to paste it in the 4000 row because I don't really want to run the engine up that high but I'll paste it in the 3600 row just so we can see a clear picture from 1700 to 3300 of what happens if we have full fuel across that operating range.
|
| 24:35 |
Now I'm going to go ahead and save this file, flash it and we'll do another dyno run.
|