224 | SD Tuning - HP Tuners
Summary
Removing the MAF sensor and performing a Speed Density patch on late model GM engines is common, particularly for those running a large cam profile or forced induction. In this webinar we’ll look at the techniques involved in applying a SD patch and calibrating the VE table using the HP Tuners platform.
| 00:00 | - Hey guys it's Andre from High Performance Academy, welcome along to another one of our weekly webinars. |
| 00:05 | Now this week we're going to be looking at the topic of speed density tuning on the GM platform, we're going to be using HP Tuners for our demonstration today. |
| 00:15 | And as usual, we're going to have questions and answers at the end of this lesson so if there's anything that I talk about today that you'd like me to dive into in a little bit more detail, please feel free to ask and we'll get into those at the end. |
| 00:28 | So first of all, we need to really define what even are we talking about with speed density or speed density patch, what does that mean, how does that effect our engine operation? So what we are really talking about is removing the factory fitted mass air flow sensor or MAF sensor and instead of using the mass air flow sensor to directly measure the airflow into the engine, we're going to instead be using the speed density principle and calculating the amount of air, the mass of air entering the engine using the input from a manifold absolute pressure sensor and that's going to also reference a volumetric efficiency table. |
| 01:07 | So particularly for anyone who has come from the aftermarket standalone tuning world, this is generally the status quo, this is the most common technique or option that we are going to be using when it comes to scheduling fuel and ignition. |
| 01:22 | We're primarily going to have a three dimensional table for fuel and ignition and one of those axes will be engine RPM and the other axis will be manifold absolute pressure. |
| 01:33 | Now before we move further, I just want to dive back and just talk about what a mass airflow sensor is and I think it's really important to understand that there are some really big benefits with a mass airflow sensor, that's why the majority of OE manufacturers tend to favour them and in some instances we may actually do better by retaining the stock mass airflow sensor, there may be no real advantage in replacing it. |
| 01:58 | So that mass aiflow sensor, as its name implies is there to measure the mass of air entering the engine. |
| 02:04 | Now what that looks like, if we just head across to my laptop screen for a moment, this is the engine bay on our Holden Commodore that we're using for our demonstration and we've got our mass airflow sensor sitting right here on the inlet to the throttle body. |
| 02:19 | Just so we can get a bit of perspective around how that actually looks, this is a wider shot of the engine bay and again here is our mass airflow sensor. |
| 02:26 | Now it's important to mention that this has been relocated, this isn't the stock location and normally our mass airflow sensor would actually sit up over here, we'd end up with some inlet piping that runs to that and then out of shot over here there is an air box. |
| 02:42 | So instead, what we've done because it makes a lot more power, is we've installed a VCM Suite OTR or over the radiator cold air intake. |
| 02:50 | That obviously relocates that mass airflow sensor straight onto the inlet of the throttle body. |
| 02:56 | So location irrespective though, basically it's set up somewhere in the air stream where all of the air entering the engine passes through that mass airflow sensor and in this way it can send out a signal to the ECU, in the case of the GM mass airflow sensor, it sends out a digital frequency and that frequency basically corresponds to the mass of air going into the engine. |
| 03:20 | Now why this is all important is that if the ECU knows accurately what mass of air is entering the engine, and it's also going to have some other tables inside the ECU that define how big the injectors are or in other words what mass of fuel will be delivered for a given pulse width that's sent out to the injector, then it's really easy for the ECU to decide what pulse width it needs in order to get a specific target air/fuel ratio for any current combination of engine load and RPM. |
| 03:52 | So what I mean by this is it really simplifies the fuel tuning in particular because instead of those big three dimensional tables of numbers that we are so familiar with, with an aftermarket standalone ECU, we simply ask for a specific air/fuel ratio and in the case of most OE cars, this gets even simpler, or in the case of GM in particular. |
| 04:15 | GM simply break the engine operation down into two modes. |
| 04:17 | It's considered to be either running in closed loop mode where it's always targeting the stoichiometric air/fuel ratio of 14.7:1 or alternatively it's in power enrichment. |
| 04:29 | So it makes it really easy for the tuning because when we're in closed loop mode, we don't even need to say anything, we already know, the ECU knows it's targeting 14.7:1 and it'll just get us there. |
| 04:41 | When we go into power enrichment mode, we'll have a look at how that all works as well. |
| 04:45 | So let's head across to my laptop screen. |
| 04:47 | So before we dive into those two tables or the table that I want to look at, let's just have a look at what a mass airflow sensor calibration looks like. |
| 04:53 | So we're on that table right here, airflow versus frequency, we'll open that up and on the horizontal axis here we have our mass airflow frequency in hertz. |
| 05:05 | And this is just defining for a given frequency, what the mass airflow is. |
| 05:09 | So for example, if we're here at 3600 hertz, if that's what the engine control module is receiving from the mass airflow sensor, it knows that it is receiving 11.96 grams of airflow per second. |
| 05:22 | It's a little bit hard to make much sense of this when we're looking at it numerically so we'll switch across to our graphical view and here we've got our mass airflow on the vertical axis, we've got our mass airflow sensor frequency on the horizontal axis and there of course we've got our graph, or our shape to our curve. |
| 05:40 | And we see we've got this kind of exponential shape that I'm doing a really horrible job of tracing over. |
| 05:46 | But in essence, when we've got this all dialled in, we should have a nice smooth shape, no big dips or humps in it and again makes it really easy for the ECU to know how much fuel to deliver. |
| 05:57 | And I've already talked about the GM engine control module. |
| 06:01 | Basically breaks the operation down into closed loop mode where we're targeting 14.7:1 or open loop. |
| 06:07 | Let's have a look at the open loop and how we define our open loop air/fuel ratio targets. |
| 06:11 | So what we'll do is we'll head across to our fuel tab here and we're going to be on our power enrichment tab. |
| 06:19 | And basically, there's a bit of information here but the two key aspects we're interested in is we've got this table here that defines the throttle position versus RPM, where the engine control module will switch from closed loop to open loop operation. |
| 06:31 | So we can see that as the RPM increases, we're going to switch into power enrichment sooner. |
| 06:38 | Then we've got our actual air/fuel ratio targets and these come from our power enrichment equivalence ratio target tables, we've got one for gas, one for alcohol, this is only a petrol car so we're on this gas table. |
| 06:50 | So instead again of our aftermarket ECUs with three dimensional tables, we've got this really simple two dimensional table here of numbers. |
| 06:58 | We've got our equivalence ratio target versus our engine RPM. |
| 07:02 | Now first of all we need to know what that term means, what is equivalence ratio. |
| 07:06 | It's simply the inverse of lambda. |
| 07:09 | So to turn this into something sensible, if we bring up our calculator here, we can show you how that works, 1.176. |
| 07:15 | Now if we use the inverse function here, this will turn it into a lambda target. |
| 07:21 | So we can see, 1.176 is the same as lambda 0.85. |
| 07:25 | If you prefer to work in air/fuel ratio units, that's no problem, we can simply multiply that by the stoichiometric air/fuel ratio of pump gas, 14.7, finally we see that that's 12.5:1 So this is a long winded explanation of how the mass airflow sensor works. |
| 07:41 | I think before we look at speed density, it's just important to get your head around this as well so you know what's going on here. |
| 07:47 | Now I'll just reiterate again that this system, when it's dialled in well, and dialling it in is really quite straightforward, we've got webinars in our archive covering the process of correctly scaling a mass air/flow sensor. |
| 08:02 | It's also covered in our worked examples in our practical reflash tuning course, so if you are interested in learning more, you can check out either of those resources to see how it's done. |
| 08:10 | But when it is done properly, it's really really straightforward and it takes a lot of work off us as tuners because again, we've really only got this two dimensional table here to play with for our air/fuel ratio targets. |
| 08:23 | And of course once the mass air/flow sensor's calibrated, we simply enter the number we want in there and that's essentially what we should get. |
| 08:29 | So really straightforward. |
| 08:31 | Now if you're wondering how that relates to our spark tables, we'll just quickly head across there and we're looking here at our spark base table. |
| 08:39 | We now have got a three dimensional table, we've got RPM on our horizontal axis. |
| 08:44 | This time we have got a parameter for our load which is listed as spark air mass. |
| 08:49 | So this is air mass in grams per cylinder, so this is actually still derived from our mass airflow sensor input. |
| 08:56 | So basically that mass airflow sensor, the output of that to the engine control module, that drives everything about how the engine's going to run, both our fuel and our ignition. |
| 09:05 | Again just to reiterate, really important how that's done. |
| 09:07 | Alright so we're here to talk about speed density patches though so I'm not just here to sing praises about the mass airflow sensor. |
| 09:14 | It's important to understand though whether or not you should be considering a switch from a mass airflow sensor to a speed density operating system. |
| 09:23 | And often I think the answer there is you shouldn't. |
| 09:27 | In a lot of cases I know tuners go and remove the mass airflow sensor thinking that they're going to see some large increase in power because it's a restriction. |
| 09:35 | And in the majority of cases, in my experience, that actually doesn't pan out. |
| 09:40 | There are however two clear cases where, yes a mass airflow sensor can be maybe, you can work around it but can be problematic and maybe a speed density patch is the way to go. |
| 09:50 | So the first of those would be if you're running a Gen 3 LS1, probably getting a little bit old now but the Gen 3 LS1, right at the very early days of the LS engine, they ran a mass airflow sensor that was quite small and definitely that was a restriction. |
| 10:07 | So we found through my old shop that doing more than throwing away the mass airflow sensor and fitting an OTR intake and re tuning using a speed density operating system, we would pick up anywhere from 15 to maybe 25 wheel horsepower. |
| 10:24 | So definitely a worthwhile upgrade on those particular cars. |
| 10:27 | On the later LS2, L98 and on and on we go of course, this hasn't really been the case. |
| 10:34 | This particular car, again getting a little bit old now, in terms of the latest LS technology, but a good case in point anyway. |
| 10:43 | With this car we've got inch and 7/8th headers, three inch catback exhaust, high flow catalytic converters and that OTR that we've already looked at. |
| 10:50 | And in this particular setup, we see no more than maybe one horsepower, two horsepower difference between running with the MAF in and the MAF out. |
| 10:59 | And that's really just a case of a run to run variation. |
| 11:02 | So LS1, if you've got a small mass airflow sensor that's proven to be restrictive, obviously we want to get rid of that as quickly as possible. |
| 11:10 | The other option is if you're running a really aggressive cam with a lot of overlap, particularly if you have got the mass airflow sensor fitted right to the throttle body like we've got here on our Holden Commodore, then this can also be problematic, you're going to get potential problems with reversion pulsing, particularly around about idle and this can make it really hard to get the engine to idle smoothly, can be really hard to maintain good control of your air/fuel ratio. |
| 11:36 | And sometimes it can just make it simpler and easier with a big cam to move to a speed density operating system. |
| 11:43 | Of course the other option as well is if you are turbocharging or supercharging one of these engines, while yes you can run a mass airflow sensor, it's another area where speed density becomes an option. |
| 11:53 | Alright so what are you going to need if you want to go to a speed density system and get rid of that mass airflow sensor? There are, it's not very difficult but there are a few key steps that you need to take and you need to do these in order to make sure that you've ticked all of the boxes, otherwise you're going to have problems when you come to start the car and actually perform your tuning. |
| 12:15 | So the first thing is, we physically need to remove the mass airflow sensor out of the intake system. |
| 12:20 | So let's head across to my laptop screen, obviously we know that that sits in here between our OTR intake and our throttle body. |
| 12:26 | Now in this case, VCM Suite offer the option to run either MAF in or MAF out. |
| 12:32 | So this is a little MAF removal kit that is optional. |
| 12:36 | So we've got a little rubber bellows here that sits between that OTR and the throttle body. |
| 12:42 | So that allows us to get rid of the mass airflow sensor out of the system, still retains some flexibility as the engine moves on the engine mounts. |
| 12:48 | We've also got a little hole in this rubber bellows that is going to be for our intake air temp sensor. |
| 12:57 | So this is one of the key points, when we are removing the mass airflow sensor we do need to understand that with the later mass airflow sensors, the IAT, intake air temp sensor, is a component of the mass airflow sensor. |
| 13:09 | So when we unplug that mass airflow sensor and throw it away, we're also losing the inlet air temperature sensor to the engine control module and that's a really critical aspect if we want the engine to be able to run properly and also maintain consistent air/fuel ratios as the air temperature changes. |
| 13:26 | Also if you just have that unplugged, it reverts, I can't remember off the top of my head but reverts to something fairly horrific. |
| 13:33 | So it's definitely completely out of the ballpark so this is a nice neat solution there. |
| 13:39 | Of course you can make up your own but pretty cost effective solution there to get that done. |
| 13:45 | So the next step is of course we need to actually set our engine control module up and run it in a speed density operating system. |
| 13:54 | So i want to go through the steps that are involved in that process. |
| 13:58 | So let's head back across to the laptop screen and we'll start here, when we are doing this, let's try and get back to where we're supposed to be. |
| 14:09 | We're going to be operating here on our, moving over to our operating system or OS tab, so we'll click on that and what we want to do is apply our speed density patch. |
| 14:22 | We can see that that is currently applied. |
| 14:25 | So when you've got an engine control module that has got an existing factory tune in it, you're going to need to initially apply that speed density operating patch. |
| 14:38 | So once you've done that, there are a couple of steps to take here. |
| 14:42 | First of all you need to save the calibration that you've just changed the operating system on, give it a new name, a unique identifier. |
| 14:50 | And in this case we're going to call this SD as the end of the calibration name. |
| 14:56 | Once you've done that, you need to close that file down, open your file that you've just saved and then you need to perform a write entire. |
| 15:04 | So we can do that by going over to our little vehicle write icon. |
| 15:08 | And here we've got the option to write to our engine control module or our transmission control module or both. |
| 15:15 | We aren't doing anything with our transmission control module so we want to select do not write. |
| 15:22 | Now normally when we're making changes and flashing those changes into the ECM, we're going to select write calibration here. |
| 15:29 | It's pretty quick, on this particular E38 engine control module, we're around about 40 seconds for a write so nice and easy. |
| 15:36 | For this first write though when we've applied the speed density operating patch, we are going to have to select write entire. |
| 15:44 | And this is a much slower process, write entire is going to take I think in this case around about six minutes. |
| 15:51 | So don't worry though, once you've done that for the first time, you're good to go and you can drop back to just performing the 40 second flashes as you are dialling your calibration in. |
| 16:03 | So that's the first thing, basically that is a modification to the way the factory engine control module works that HPTuners have written. |
| 16:10 | So basically it allows us to get rid of that mass airflow sensor and instead it's going to give us a volumetric efficiency table which is not there in the factory ECM. |
| 16:21 | So it's really important to understand this is an aftermarket modification, this is not the way GM intended the ECM to work, HPTuners are actually modifying that. |
| 16:31 | Alright so now we've got that out of the way, there are a couple of other steps that we need to go through here. |
| 16:39 | So once we've got our mass airflow sensor out of the system, we physically need to tell the engine control module that the mass airflow sensor has failed so it will drop back to the speed density operating system. |
| 16:51 | So what we can do here, if we go into our engine diagnostics, the first place we need to work here is on our mass airflow sensor frequency fail high, frequency fail low, so in stock form you're going to find that the frequency fail high point I think is about 14,500 hertz and basically it says, if you click on this, you can read down the bottom there, this is the frequency threshold above which the VCM will set the mass high frequency DTC. |
| 17:21 | So that's P0103. |
| 17:23 | So what we want to do is basically make sure that the mass airflow sensor is deemed to be faulty so that it drops back into that speed density operating system. |
| 17:31 | The other thing we want to do though, clearly we don't want DTCs or check engine lights coming up on our dash. |
| 17:38 | So we need to head across to our DTCs tab and we need to disable those so that they're not going to come up. |
| 17:46 | So we'll just cycle down until we see all of the ones relevant to our mass airflow sensor. |
| 17:51 | So that's P0101 through to 103. |
| 17:56 | Now the important thing here, and this is an area where you can make mistakes, I've already gone through and set this up so you can see I've got these selected, the error mode is no MIL light. |
| 18:06 | Now if we look at the drop down menu option here, we've got no error reported, MIL on 1st error, MIL on 2nd error, or no MIL light. |
| 18:14 | Really common mistake I see people make is that they select no error reported. |
| 18:19 | Now this is what we would do with a lot of the other DTCs that we don't want coming up, let's say for example you want to remove your catalytic converters and you want to remove the PE0402 error for the catalytic converter efficiency, so that's a classic example where no error reported is the correct option. |
| 18:37 | Here again we need the ECM to see that the mass airflow sensor has been faulty, so this is why we don't want to select no error reported, we want to go with our no MIL light. |
| 18:50 | Alright so in this instance, the operating system that we have flashed in is a two bar speed density patch so it allows us to fit up to a two bar MAP sensor, allowing us to run up to one bar of positive boost pressure, it's an absolute sensor. |
| 19:06 | Now the problem with this is we may not be fitting a sensor there that will read up to two bar so again what we need to do here is go to our general airflow tab, so we're on our airflow tab here. |
| 19:20 | And we need to check our MAP sensor characteristics. |
| 19:23 | So what you'll find is that this will straight away, as soon as we apply that speed density patch, that MAP sensor linear will revert to 200 kPa. |
| 19:32 | So this is a problem because chances are, that's not the MAP sensor that you've fitted, particularly if you're doing a naturally aspirated engine, you've fitted a big cam, this is the example I gave. |
| 19:42 | There's no need to fit a two bar MAP sensor so you're of course going to be retaining the factory sensor. |
| 19:49 | If you don't pick up on that, you're going to get, the engine control module will be seeing a completely inaccurate manifold pressure signal. |
| 19:56 | So it's obviously going to play havoc with the way the engine runs. |
| 19:59 | Now a really good way of just checking that is we can use the compare function here. |
| 20:04 | So this is what I like to do is open a compare file and we can cycle down to an existing file here, so basically the file before you applied that speed density patch and you can just check between the original file and your new file. |
| 20:20 | So if we look at that, despite the fact it's actually showing green we can see that the values there are exactly the same. |
| 20:26 | So this allows you to copy and paste, making sure that your MAP signal will still be correct. |
| 20:34 | Alright so we've got some of our basics covered off there. |
| 20:37 | We've got our MAF sensor has now, will now be deemed to be faulty. |
| 20:43 | And now what we've got, the actual reason that we've gone about this is we've now got a series of tables here which we can see under main VE, these are the tables that have now been introduced with that speed density patch that don't exist in the factory GM ECM. |
| 20:59 | So we've got three there, we've got normal inlet manifold runner closed, open and displacement on demand. |
| 21:07 | So which of these will be used is going to depend on your engine configuration. |
| 21:11 | In general, just to make sure that I'm not overlooking anything, I will make sure that all three of these tables are identical and what I'll do there is simply copy and paste, as I make a change I'll copy and paste that change to all three tables. |
| 21:26 | Now the problem that you're going to have here, I'll just click on that table. |
| 21:29 | So it looks like a conventional speed density table, we've got manifold pressure or VE table I should say, we've got manifold pressure on our horizontal axis, RPM on our vertical axis. |
| 21:39 | The numbers however in this table, first of all if you have just applied that speed density patch, your first problem is that these are going to be filled with zero. |
| 21:48 | So that's a bit of a problem, you're going to need to populate numbers into this table to start with. |
| 21:54 | And the other issue is that the numbers aren't like a conventional VE value which you might see between maybe 30% and maybe 100, 115%. |
| 22:05 | Obviously we've got numbers there up to 2500 or thereabouts. |
| 22:09 | So the numbers here are what's referred to as GM VE. |
| 22:13 | I'm not going to get into the background of how this is all calculated but essentially for our purposes it doesn't matter, they work exactly the same. |
| 22:21 | If we want to double the fuel delivery, we double the GM VE number. |
| 22:25 | So we can apply percentage changes to these values exactly the same way as we would in an aftermarket ECU with a conventional 0% to 100, 115% VE table. |
| 22:37 | So if you are getting started, obviously it takes a bit of time to build up one of these maps. |
| 22:43 | What we might see if we can do is add the file that I'm working on here to this webinar after it's aired so our members will be able to download that. |
| 22:53 | I mean it's obviously not going to be right for your particular car but it's helpful if you can get something that'll actually get you up and running so you can start your tuning from. |
| 23:02 | And again this is an area where I see a lot of people that apply their first speed density patch on HPTuners, go to start the car, won't run, just cranks and won't fire and the reason for that is that they haven't gone and put any numbers in this table. |
| 23:15 | OK so we've got that dealt with, this is enough that we've actually got our engine up and running and we'll show you in a second how we can go about using the scanner to help optimise those numbers. |
| 23:26 | So we move on here, there is another aspect we need to cover off here with the way the spark tables are defined. |
| 23:34 | So what we're going to do is go over to our spark tab here. |
| 23:38 | And just like with a mass airflow sensor we've got two tables, we've got high octane and low octane. |
| 23:45 | And this is one of the downsides I guess with the speed density patch. |
| 23:48 | With the mass airflow sensor operating, what we basically do is the engine control module will start using the high octane values which should be more advanced numbers than the low octane numbers. |
| 24:00 | And basically due to feedback from the knock retard subsystem, if they're seeing a lot of knock retard, the engine control module over time will start biasing away from that high octane table down towards the low octane table. |
| 24:12 | So basically over time it can learn, great if you are using a low quality batch of fuel because that knock retard system is not predictive. |
| 24:21 | It can only respond to actual knock events. |
| 24:24 | So of course we don't really want our engine knocking if we can avoid it. |
| 24:28 | So by using that adaptive ignition control system it basically allows the engine control module a big of power to adapt the actual timing that's going into the engine. |
| 24:38 | However, when we are using the speed density patch we lose that benefit, and what we want to do is make sure that we are working in our low octane table. |
| 24:47 | So the way of doing this is generally we'll start by just copying our high octane advanced values and paste those down into our low octane table so that the tables are the same. |
| 24:59 | Now I know that a lot of tuners do this irrespective of whether they're tuning on a MAF or a speed density patch. |
| 25:05 | Definitely not something I would recommend. |
| 25:07 | If we are using a mass airflow sensor, that system, when it's dialled in well, actually works amazingly well and is definitely something that I want to retain to provide some protection for the engine if it is getting a bad batch of fuel. |
| 25:20 | Actually I missed out as well, we'll head back to our airflow and our dynamic tab as well and the factory GM engine control module does actually use a combination of mass airflow sensor and a speed density subsystem for transience. |
| 25:35 | So this is probably superfluous because we have failed the MAF but just as a matter of course, I also like to disable the dynamic airflow, so set the high RPM disable to maximum which is 8192. |
| 25:50 | So this is where, if we read the little description at the bottom, above this RPM the engine control module will use filtered mass airflow sensor air mass for the prediction, so we don't want to be doing that. |
| 26:01 | We're solely on our speed density patch. |
| 26:04 | Alright so I think we've got most of our setup dialled in here. |
| 26:08 | So at this point we would actually be able to get the engine up and running. |
| 26:11 | However we're obviously going to need to dial in that speed density, the volumetric efficiency table now, get that all correct and that's going to require us to use our histograms which we're going to look at in a minute. |
| 26:25 | Now there's no necessarily right or wrong way of doing this. |
| 26:28 | I know a lot of tuners will use the short term and long term fuel trims and populate that into their histograms. |
| 26:36 | The problem I see with this is that it can be effective in closed loop mode but it's not going to be great when we're at wide open throttle and we are in power enrichment where our target's going to be richer than stoich so what I like to do regardless if I am calibrating a mass airflow sensor or the volumetric efficiency tables is disable our closed loop mode. |
| 26:57 | So if we can go to fuel and we can go to our open loop base, no sorry our oxygen sensors. |
| 27:04 | So our O2 readiness here, we've maxed out the numbers in this table here. |
| 27:09 | And we've also gone ahead and maxed out the engine coolant temperature limits for our long term fuel trims. |
| 27:19 | So basically that's just going to ensure that our ECM can't go into closed loop mode. |
| 27:23 | So it's not going to be trying to make corrections for any errors in our tuning. |
| 27:29 | The other thing again, just for setting this up, while we are dialling this in, regardless whether we're using a VE table or we're using the mass airflow sensor. |
| 27:38 | Just to make life a little bit easier, I like to start with a flat power enrichment table and you may actually notice, may have noticed that's exactly what we've got at the moment. |
| 27:48 | So at the moment I've got this set to 0.85 lambda right through the rev range. |
| 27:52 | Not something that's very realistic. |
| 27:55 | Once we've got this dialled in we'd likely want to target a slightly leaner air/fuel ratio down at lower RPM. |
| 28:02 | Maybe even slightly leaner still than 0.85 right at red line, so we can adjust that. |
| 28:08 | But while we're dialling in the VE tables, that's how we're going to set that up. |
| 28:12 | Alright we're going to have a look at our scanner and go through a bit of a practical demonstration of this now and after that we will have some questions. |
| 28:22 | So it's probably a pretty good time to suggest, if you do have any questions that you'd like to ask, please ask those in the chat and we'll get into those shortly. |
| 28:30 | But before we do so, let's head across to our scanner and I've already got some data up here so I'll sort of explain what we've got going on and how we've got this set up. |
| 28:40 | So let's just get recording here. |
| 28:44 | So key pieces of information that we need, coming into the scanner. |
| 28:49 | We've got, at the bottom here two graphs, we've got green as our commanded equivalence ratio or commanded lambda. |
| 28:56 | So this is what the engine control module is asking for. |
| 28:59 | Obviously sitting here at idle at the moment it's asking for lambda one, stoichiometric. |
| 29:03 | We can see in yellow there, that is our wideband air/fuel ratio data coming in from our Innovate LM2. |
| 29:09 | And you can see while I've been talking here, we're sitting 8-10% lean, we're sitting at about 1.08 to 1.10 lambda. |
| 29:17 | So definitely leaner than is ideal. |
| 29:20 | Just to show that there is no funny business going on here as well, we've got our short term and our long term fuel trims, they are all sitting at zero. |
| 29:29 | Now I showed you how you can disable the closed loop control inside of the VCM Editor software but you can also do this with our scanner control. |
| 29:37 | So we'll just click on that here. |
| 29:39 | And if we go through to fuel, you can command closed loop mode either on or off. |
| 29:46 | So there is a couple of ways to skin that cat there depending on your personal preference. |
| 29:51 | Alright so what we've got her though, the key or the heart to this really is in our histograms or in our graphs. |
| 29:59 | And I want to just show you what we've got set up in our histogram and how that works. |
| 30:05 | So I've got a bunch of histograms here, for those who aren't aware of what a histogram is, basically it's just a way of logging a lot of data over a long period of time and getting some nice averages of all of that data. |
| 30:17 | So what we've got here is a histogram that I've called equivalence ratio error speed density or SD for short. |
| 30:25 | Now the important thing here is we've got the same axes, so we've got engine RPM on our vertical axis and we've got manifold pressure on our horizontal axes. |
| 30:33 | These are the same, if we head back to our editor for a moment, we'll close that down, we'll head back to our airflow, back to our general and back to our VE tables that we've got. |
| 30:46 | We can see we've got exactly the same axes here. |
| 30:48 | So that's really important because when we've got these set up with the same axes and the same break points, allows us to scan data in and then we can use that paste special function that's so helpful for speeding up our process of dialling in these tables. |
| 31:02 | So we'll head back to our scanner. |
| 31:04 | So while I've been talking here we've obviously been just in one zone at idle and basically it's showing that we are needing to add or we're about 8.8%, let's call it 9% lean at that particular point, which kind of corresponds to the lambda numbers that we were looking at. |
| 31:23 | So as we move around this table, that's going to fill this table in with our equivalence ratio error so essentially how far our measured lambda is away from our target lambda, that's going to give us the magnitude of the error and basically any time there's an error there, that means that our VE table isn't correct. |
| 31:40 | So we're going to then apply that error to our volumetric efficiency table to help us dial that in. |
| 31:47 | Now before we get into a demonstration of this in action, I'll just show you how to develop one of these histograms because depending on the particular controller that you're dealing with, the break points, or even the order of the axes may be different. |
| 32:02 | So if we right click here and we go to graphs layout, we can either edit one of our existing ones or we can add a new one. |
| 32:11 | So we'll go to our equivalence ratio error SD histogram, we can give that a label and we can in this case, we are logging two decimal points of percentage error into that table. |
| 32:25 | I've also coloured the error so if the error is positive, that means we're lean, so that's red, means we need to add fuel, it's lean, we're dangerous. |
| 32:34 | Green on the other hand, we're too rich, we need to remove some fuel. |
| 32:37 | Then we can set up our column axes and our row axes. |
| 32:42 | So we're just going to replicate there the parameters that have been used in the VCM Editor table. |
| 32:48 | So in this case we know that we've got manifold absolute pressure on our horizontal axis, for our columns we've got speed, engine speed. |
| 32:56 | On the row axis, our vertical axis. |
| 32:59 | And then we can go back across to our editor, if we right click here on the table and we go to column axes, copy labels, what that's going to do is it's going to copy, don't quit, thank you. |
| 33:12 | It's going to copy all of the data from our manifold pressure axes here, it's going to put that on the clipboard and the nice thing is that then when we come back here we can highlight all of this data here and we can paste and that's going to insert all of those break points. |
| 33:28 | So really quick and easy to set that up and make sure that it's going to give us good data. |
| 33:34 | Well data that we can easily use. |
| 33:36 | Now there's a few keys that we need to understand when we are gathering data using a histogram regardless of what we're using that histogram for. |
| 33:45 | Particularly when we're looking at error data for our air/fuel ratio for VE, or for dialling in our mass airflow sensor, one of the key points is to make sure that the engine is up to normal operating temperatures and it's not suffering from heat soak. |
| 33:58 | It's quite common that we will see some garbage data immediately after startup, particularly if the engine is heavily heat soaked, so we want to get rid of that. |
| 34:06 | And obviously we've been sitting here now for about an hour with this engine running so safe to say that we don't have any heat soak left. |
| 34:12 | A good way of dealing with that as well is we can stop and we can start our scanner once we're actually ready to start gathering good solid data. |
| 34:21 | And that'll get rid of any of that garbage data that's not relevant to us, making sure that our histogram's only filled out with good valuable data. |
| 34:29 | The other thing is when we are driving the car, much easier if we are on the dyno, it's a good idea to make sure that we are trying to stay, wherever possible, in a single gear so there's no gear changes doing anything silly. |
| 34:41 | We want to also be very very smooth with our application on the throttle to make sure that we're not bringing in any transient enrichment that could affect our results. |
| 34:51 | So what I'm going to do now, we'll just pull the car into gear here. |
| 34:55 | And we're going to do this in two separate ways, we're going to gather some data in steady state using our dyno to control our wheel speed and hence our engine RPM. |
| 35:05 | So I'm just going to gently get us into fourth gear here. |
| 35:10 | And then once we've done this, we're going to then gather some data using a wide open throttle ramp run here on our Mainline dyno. |
| 35:16 | So again just smoothly got us into fourth gear using very minimal throttle input. |
| 35:22 | And what we're looking for here is the numbers in our table as we move into a new cell so what we want to do is basically move into a cell, stay stable in that cell until we've got a consistent result and then what we can do is we can apply some throttle and that's going to increase our engine RPM. |
| 35:42 | So at the moment we're at 1800 RPM and while I'm doing this I want to be careful to monitor our engine RPM there and try and maintain as close to that 1800 RPM as I physically can. |
| 35:54 | So as I increase the throttle position here, due that we've got an automatic transmission, we do see some converter slip so we tend to see that RPM creep up slightly as we go from closed throttle to wide open. |
| 36:06 | I'm just going to be using the dyno to control that, so let's just go through our 1800 RPM column. |
| 36:12 | We'll just come up to 35 kPa there, just allowing that a little bit of time there for our numbers to stabilise. |
| 36:18 | And pretty stable there, so we'll go up to 45 kPa. |
| 36:22 | You can see that this only takes a few seconds here, I'll come up to 50 kPa. |
| 36:27 | Now we do need to be careful here as well because at some point, it's not going to happen until we're pretty close to wide open throttle but at some point we're going to end up moving into power enrichment. |
| 36:38 | And if we do that, we're going to end up with a momentary large error in our histogram that's going to be really unrealistic because the measured air/fuel ratio can't instantly jump to our open loop target. |
| 36:53 | So what we're going to do is try and gather data in two ways here, using the steady state to deal with closed loop where we are only targeting lambda one. |
| 37:01 | So in that respect, it's a good idea just to keep an eye on your equivalence ratio commanded, make sure that's staying at lambda one. |
| 37:09 | Alright so we're up to 55 kPa so we'll just continue to increase the throttle here. |
| 37:15 | And we're still within about 50 RPM of our target of 1800, coming up to 65 kPa, 70. |
| 37:22 | So we're starting to see a bit of a pattern emerge there where at low manifold pressure, we've got, we're a little bit lean. |
| 37:30 | As we're going towards wide open throttle here, we're going to come up to our 85 kPa cell. |
| 37:36 | I should be able to get to maybe 90 kPa without going into power enrichment here. |
| 37:44 | Alright so we're still in our closed loop operation. |
| 37:47 | So our 1800 RPM column, we've pretty much got that dialled in. |
| 37:51 | What we can do now is we can just increase our dyno set point up to 2000 RPM. |
| 37:57 | This time I'm actually going to go backwards and I'm going to go from high load down to low load, doesn't really matter as long as we're nice and smooth with our throttle inputs. |
| 38:06 | And we'll just fill in this second RPM column. |
| 38:09 | And we see as soon as we move into a new cell, doesn't take more than a couple of seconds of the numbers in that cell to stabilise. |
| 38:16 | So we'll just come back down through here. |
| 38:21 | Get all the way back down into vacuum and then we'll stop and we'll have a look at our results. |
| 38:27 | And it is a good idea when we are doing this as well, as you're coming to the end of a cycle where you're gathering good data, you want to stop your scanner so that as you come back down to idle or come off the throttle, you're not going to end up destroying the data that you've just gathered so let's just get back down here to minus 25 kPa if I can. |
| 38:50 | Alright we'll stop the scanner and let's have a look at our results there. |
| 38:53 | So what we've got there is just a couple of pieces of that puzzle there, a couple of slices of our VE table. |
| 39:01 | But what we want to do is first of all, have a brief look at this data and see if it looks believable. |
| 39:07 | What we're looking for here is outliers in this data, anywhere where the data doesn't make sense. |
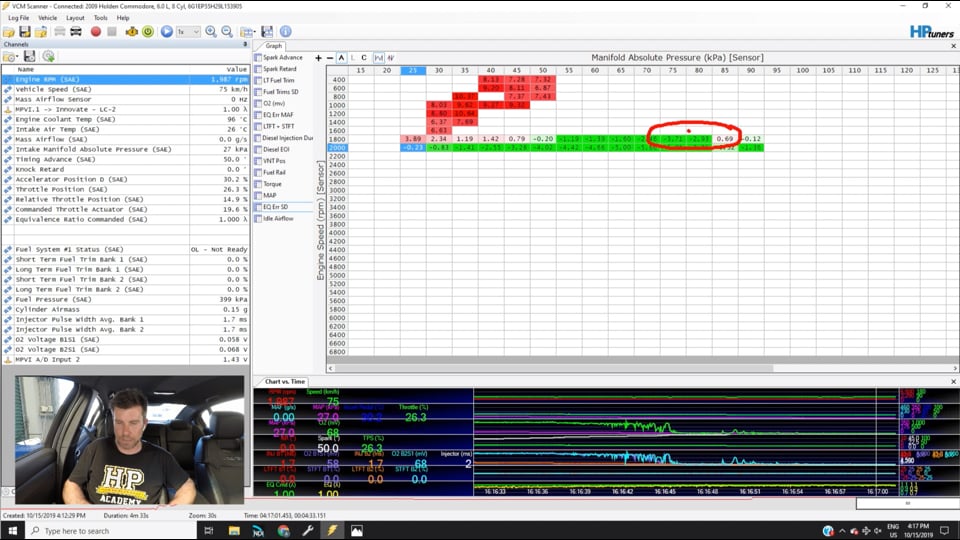
| 39:12 | So in particular if we look at this data from 25 kPa, 1800 RPM up to this point around about maybe around about here, 70 kPa, we've got a reasonably steady trend. |
| 39:25 | We've gone from, at almost closed throttle we're about 4% lean. |
| 39:29 | When we're up at 70 kPa we're about 2.5% rich. |
| 39:33 | So that's a pretty steady trend, makes sense to me, I'm happy with that. |
| 39:37 | What we're starting to see here though is a little bit of error or some bits that I would be a little bit suspicious of, in particular here at 85 kPa we've got an error where all of a sudden we're a touch lean, 0.69% lean, not a big deal bit the surrounding cells are 3% rich and then we're just very slightly rich at 90 kPa. |
| 40:03 | So when we've got something like that, generally I'd want to back and readdress that cell and see if that's actually the case and we've kind of got the same situation happening in both of these columns so it might actually be accurate. |
| 40:13 | We can also click on, if we've got, this little C icon here stands for count. |
| 40:19 | So we can see how many pieces of data we've gathered in each of those cells. |
| 40:23 | So we'd just want to see that we've got a good number of hits in each of those cells, generally a couple of hundred, maybe 400 hits in each cell means that we've probably got some pretty accurate data. |
| 40:34 | You can see down here as I transition through we've got two hits, nine hits, probably not going to put much weight behind that data being accurate. |
| 40:42 | So just to go back to our average, just to again allow you to make sure that you're getting good data. |
| 40:48 | So once we've got this data we can then apply it to our VE table and there's a couple of ways we can implement that. |
| 40:54 | What we can do is we can copy the entire data out of that histogram. |
| 41:00 | We can go back to our scanner and then what we can do is we can use our special paste, or paste special function, multiply by percent. |
| 41:10 | And what that's going to do is directly apply all of those percentage errors that we've just gathered into our table. |
| 41:16 | Now a lot of people use that blindly, it's a very powerful tool but it does need to be used with a little bit of common sense. |
| 41:22 | First of all, if you've got rubbish data, it's going to apply that rubbish data straight into your VE table and basically it's a case of garbage in garbage out. |
| 41:31 | Obviously you're not going to get the results you want. |
| 41:33 | So that's why it's so important to make sure that your data is sensible. |
| 41:36 | The other aspect here is that you're going to see that there's areas where we can't easily get to, particularly on the dyno. |
| 41:43 | And we want to extrapolate out those trends. |
| 41:46 | So for example if we were going to use that paste special function, I want to take note of the fact that in this 1800 RPM column, as I go below 25 kPa, I'm probably going to want to extrapolate that trend out and maybe add 3.5-4% to these two cells. |
| 42:06 | Exactly the same situation here, we can see even with the little bit of data we had, we've got errors out in here between 6% and about 10% so we'd want to apply those to the cells that we didn't get any data from, likewise these cells here. |
| 42:20 | So it can be really difficult to gather all of that data at very low RPM because particularly with an automatic transmission, our transmission wants to shift down so we want to be a little bit sensible with that. |
| 42:33 | The other way we can do this is just apply some hand smoothing or hand adjustments to the table. |
| 42:40 | Basically if we looked here and said well it's not quite the case but let's say we looked at this data for 2000 RPM and we had a little bit of up and down but for the most part we saw a trend where we were about 3% rich well what we could do is choose to highlight that entire column and remove 3% from the VE table. |
| 42:58 | So no specific right or wrong way to deal with that, just a case of understanding what you're doing. |
| 43:04 | So this becomes an iterative process and once we apply those changes, we're just going to test again. |
| 43:09 | Generally you should be able to get this dialled in in no more than about two or three iterations. |
| 43:15 | We're not aiming for perfection, if you want to try and get all of those numbers sitting on zero, you're going to end up wasting a lot of time and frustrating yourself. |
| 43:22 | The reality is, if we are within perhaps plus or minus 2% or 3%, we're doing a pretty damn good job. |
| 43:28 | And particularly under closed loop conditions once we re enable our closed loop control, that's going to be there to pick up any pieces. |
| 43:35 | So we've dealt with our steady state tuning there, the other aspect though is we want to also look at our wide open throttle areas. |
| 43:42 | So that's out in the 95 to 100 kPa zones. |
| 43:47 | So we're basically going to do exactly the same and this time we're going to do a wide open throttle ramp run on our dyno, so we'll get that set up. |
| 43:56 | And what we want to do is get our car ready for that run. |
| 44:00 | I'm doing to do this before I start the scanner. |
| 44:03 | And again we want to make sure of course that we aren't heat soaked at this particular point. |
| 44:09 | So we can then go through to full throttle and we can start our scanner. |
| 44:14 | We're going to wait for our scanner to stabilise and get our run underway. |
| 44:31 | Alright so let's have a look over at our dyno, we can see we ended up with 350 horsepower at the wheels. |
| 44:38 | We're not really chasing power when we're doing this but as you start fine tuning and developing the calibration, you're obviously going to be able to start taking a little bit more notice of that. |
| 44:46 | Initially what we're most interested in is just seeing how close we are with our fuelling. |
| 44:51 | So let's have a look back at our chart logger first and what we're interested in here is our commanded lambda versus our target. |
| 45:00 | And we can see we weren't too bad for the most of that, let's just ignore this ugly knock if you're wondering what that's all about. |
| 45:06 | Don't worry about that little guy, I'll deal with him in a second. |
| 45:09 | But we weren't too bad, at that start of that run we were about 2% too lean and then as we go through the run, particularly in the higher RPM once we get up around 6000 RPM we start to drop off quite rich, we're 0.76 versus 0.85 there so definitely got a little bit of work to do but for our first run there, actually wasn't too bad and we're in the ballpark. |
| 45:32 | Now talking about this knock there, this is something that we should have probably dealt with as well. |
| 45:37 | If you're working from an existing calibration, while we're dealing with this and we're dialling in our volumetric efficiency table, as we're adjusting that, essentially that is giving the engine control module the calculation of where abouts in the spark tables we're operating because it's the calculation of the mass airflow per cylinder, grams per cylinder. |
| 45:57 | So of course if our VE table is off, so too is the area of our spark table. |
| 46:02 | So it's always a good idea to just be a bit conservative and start by retarding our timing. |
| 46:07 | I didn't do that though and our engine is still running. |
| 46:09 | So do as I say, not as I do. |
| 46:11 | Let's get our graphs out of the way here and we'll have a look at the histogram. |
| 46:18 | So of course this time we have got data filled in there. |
| 46:22 | In this case we're about 380 metres above sea level so that's why our atmospheric pressure sits at about 95 kPa. |
| 46:30 | Depending where you are, you'll probably, or hopefully be getting into the 100 kPa sites. |
| 46:34 | So we can see exactly the same trend. |
| 46:36 | We're a little bit lean down in the low RPM up to about 3200 RPM. |
| 46:43 | Then as we move higher in the rev range, we're a little bit rich. |
| 46:47 | So applying the same principles there we can use our paste special function to apply those changes to our VE tables. |
| 46:55 | Or we can apply those by hand, just looking at any trends we've got. |
| 47:02 | Always a good idea as well when we're looking at this data, because we are moving through the rev range quite quickly, if we look at the count, C, we're not really seeing much more than about 50 counts in any one of those individual cells. |
| 47:14 | So again an iterative process, we're going to probably take a couple of runs to get this dialled in but once we've got our mass airflow sensor, sorry our speed density subsystem, our VE tables dialled in, we can then go back and set our air/fuel ratio targets to anywhere we'd actually more realistically like them to be running. |
| 47:35 | So as you can see, not that scary, with the help of the histograms in the scanner software, really is quite a quick and easy process to dial them in. |
| 47:44 | Certainly much quicker in a lot of ways than tuning an aftermarket standalone ECU, even if we can't make these tuning changes live. |
| 47:51 | Last thing is once you're really happy with your calibration there of your VE tables, you'll want to go back and re enable your closed loop control so you've got the ability of the long term and short term fuel trims to pick up the pieces if anything isn't quite right. |
| 48:06 | Alright we'll head into our questions, if you've got anything else you'd like to ask, please feel free to ask that now, we'll see what we've got. |
| 48:23 | Ooh looks like Scott might be adding a question here. |
| 48:27 | Alright so not quite related to this topic but Daniel has asked, with the HPTuners MPVI2 interface, when you buy credits, do you need credits for every time you want to make tuning adjustments? So the answer there is no, this is a one off. |
| 48:42 | So this is basically one of the ways that HPTuners make their money. |
| 48:46 | Obviously it's a commercial system, they are there to monetize this. |
| 48:49 | And what you need to do is every time, or I should say, I'll be really clear, the first time you go to tune a new vehicle, you need to license that vehicle. |
| 48:59 | Depends on the particular vehicle, for most instances with GM vehicles that's going to take two universal credits, around about USD$50 per universal credit. |
| 49:08 | Once you've licensed that car initially, you can then re tune it as many times as you like without needing to relicense it. |
| 49:17 | Kelvin has asked, do you always start with a flat commanded equivalence ratio table, apply the corrections and then change to your commanded equivalence ratio? Look there is no right or wrong way of doing this, every tuner is going to have their preferences. |
| 49:31 | I suggest that you try a few options and then decide on what you personally prefer. |
| 49:34 | This is my preferred way of doing it, simply because then as we move through the rev range, we're not chasing a moving target. |
| 49:41 | We've always got one fixed air/fuel ratio. |
| 49:44 | As we move through the rev range as well, just like that change from closed loop to open loop, the measured air/fuel ratio isn't going to instantly be able to track large change so if you're asking for quite a significant difference in air/fuel ratio through the rev range, we may see a tiny latency in that which will affect the error being measured which may or may not be real. |
| 50:05 | So for this reason, I prefer to start with that flat equivalence ratio target, get my mass airflow sensor or VE tables dialled in, I use the same technique for both. |
| 50:15 | And then actually go through and hit my commanded, enter my desired lambda targets after that. |
| 50:24 | Alright looks like we're a little slow on questions today so we're going to finish up there, oh no we've got one more that's just managed to get in there. |
| 50:32 | Andrew has asked, I've managed to get my hands on an FIC from AEM which is a piggyback, should I use it or chuck it and get a standalone? OK so a little off topic for today's webinar but I will answer this anyway. |
| 50:47 | So the answer really here is it depends what you're trying to do. |
| 50:51 | I am not, in most instances, a huge fan on piggyback ECUs. |
| 50:56 | But you can get good results, it really depends on whether you're being realistic about what you want to achieve. |
| 51:02 | If you've got a basic naturally aspirated engine and you're looking at doing some normal bolt on mods, maybe a new intake system, maybe a set of headers and a freer flowing exhaust, under those conditions, not really going to be straying that far from the factory calibration and under these conditions a piggyback ECU can actually get you pretty good results for a modest investment. |
| 51:24 | Where I would be a little bit more reluctant to go down the piggyback path is, I see a lot of people taking a naturally aspirated engine, turbocharging or supercharging it, fitting larger injectors, changing the MAP sensor, maybe even fitting a set of cams and while yes theoretically you may be able to get a result, the chances of you getting a really good result with a piggyback are starting to become less and less likely and particularly with a highly strung engine, you don't necessarily have the control or the finesse to make sure that that engine's going to produce good power, most importantly reliability. |
| 52:00 | So yeah take from that what you want, really does come down to what you're expecting, what you're trying to achieve with that system. |
| 52:12 | John has asked, by letting the engine warm up, does this make sure there are no temperature or other fuel compensations that will be affecting the corrections? Yeah absolutely, obviously when we start the engine from stone cold, there will be warm up compensations, warm up enrichment going on and that can in itself affect the accuracy of the fuelling. |
| 52:32 | Of course in the perfect world we'd expect to be hitting our lambda targets regardless whether the car is heat soaked, stone cold or at normal operating conditions but that's not always going to be the case. |
| 52:44 | Even with OEs, this is why we have closed loop control in these ECUs. |
| 52:48 | They know that under certain conditions, there are still going to be some errors in there and that's what the closed loop systems are there to control. |
| 52:55 | But for our purposes we want to give ourselves the best chance of getting accurate data that we can and the best chances of getting that accurate data is if we operate the engine when it is up to its normal operating temperature. |
| 53:08 | Alright that has brought us to the end of our questions there, a couple of late ones that just popped in but thanks to everyone who has watched there. |
| 53:14 | As usual if you do have any other questions that crop up after this webinar has aired, please ask those in the forum and I'll be happy to answer them there. |
| 53:23 | Thanks for joining us and look forward to seeing you all next week. |
| 53:27 | Now for those watching today on YouTube, this is just a little insight into what we put on every week for our HPA gold members. |
| 53:33 | Our gold members get the ability to review these webinars in our archive where we've currently go over 220 hours of content covering topics on engine tuning, engine building and wiring. |
| 53:44 | Absolute gold mine of information in there. |
| 53:46 | They also have access to our private member's only forum which is the best place to get reliable answers to your specific questions. |
| 53:55 | If you are interested in learning more about this, you can become a gold member for USD$19 a month. |
| 54:00 | However you're also going to get three months of free gold membership with the purchase of any of our courses. |
| 54:06 | If you want to check those courses out, head to hpacademy.com/courses Alright thanks a lot for joining us and hopefully we'll see you online again soon, cheers. |