284 | Using Digital Setup Sheets with Logged Data
Summary
A lot of data analysis can happen without introducing much complexity into your race days. However, there are cases in data analysis where making use of setup values that change throughout a race weekend inside our data analysis package can add a lot of value. We'll look at making use of live electronic setup sheets in this webinar.
| 00:00 | - Hey team, it's Tim here from RaceCraft, welcome to today's member's webinar. |
| 00:04 | Today we're talking all about electronic setup sheets so what I mean by electronic setup sheets, as opposed to a setup sheet that you've got written down for something like your mechanics or whether you're doing it yourself, it's something that you're using to transfer electronic information directly from, something about your car's setup that you can use within your data analysis project. |
| 00:26 | Now this is probably a little bit more of an advanced topic but it's something I think a lot of people out there can probably make use of so it's something I thought it was important to cover. |
| 00:36 | So what exactly do I mean by setup sheet? If we come over here to my laptop screen, I've got a couple of different examples of setup sheets here. |
| 00:44 | This is what I would say is a pretty conventional style of setup sheet where we've got some information at the top. |
| 00:51 | Things like date, what car you're running, who's running the car, what engineer, what track, all that sort of stuff, just basic record keeping sort of stuff. |
| 00:58 | Some information here about the front axle and information here about the rear axle and information on each corner of the car. |
| 01:05 | So we've got things like the corner weight, the spring rate, what the damper settings are, the camber, the caster, the toe, all that sort of stuff. |
| 01:11 | And it's split up into that either front axle or per corner perspective. |
| 01:15 | So here we've got all the information about the front left, about the front right, right rear, rear left. |
| 01:21 | We've also got a place for some notes down here. |
| 01:24 | So this is a pretty typical style of setup sheet, a lot of people will be using. |
| 01:27 | This sort of documentation is actually something I'm going to give some attention to in a future webinar, talking all about documentation or documentation you're using as an engineer or even just going to the track as a club racer, it's something I feel really strongly about as far as getting the most out of the car, it's a really important aspect that's probably relatively overlooked so I'm going to go do a whole webinar in the future talking all about that but for today we're going to be talking about electronic ones instead. |
| 01:54 | So that's one typical layout that a lot of people use as far as setup tracking. |
| 01:58 | Really just mainly just to make sure you are recording your pre event wheel alignment and setup settings as well as any changes throughout the weekend and maybe also a set down which is where you set it down at the end of the weekend to check if the settings that the end are what you expect based on what you started with and any adjustments you would have made throughout the weekend. |
| 02:17 | Another really common layout is this style of layout which is what I would call more of a column style setup sheet. |
| 02:24 | Really it's all of the same sort of information, this is the typical sort of layout I tend to use myself when I'm racing. |
| 02:30 | I tend to collect all of the relevant information into one place. |
| 02:34 | So what I mean by that is rather than splitting into each corner of the car, I've got all of the measurements or parameters collected together so for example here I've got all the ride heights for all 4 corners of the car, all the cambers, the casters and obviously caster only applies to the front axle so we've got just a place to put the front axle caster here, we've got toe, blah blah blah, springs, helpers, anti roll bar spec, whatever it is. |
| 02:56 | It's all sorted into columns like that. |
| 02:58 | That's just another example of a common way people do their setup sheets. |
| 03:01 | The way I normally actually set it up is actually in single columns when I'm doing it electronically but as we'll see I've got another variation that we'll go through as far as making use of an electronic setup sheet. |
| 03:13 | So the next thing I want to talk about is why I'm actually talking about an electronic setup sheet in the first place, what do I actually mean by that? So as I said earlier, this sort of style of setup sheet that we've got up on my screen now is really for making use of recording your setup parameters that you're using on your car for that race weekend or that day that you're at the track. |
| 03:35 | What I'm talking about today with electronic setup sheets is taking some of that data that I want to make use of in my analysis project and linking it to my logged data so I can do maybe more interesting or more useful calculations. |
| 03:47 | All of this comes from, it's actually a question I had in one of the previous member's webinars, people asked how do I make use of some of my setup parameters or changing parameters in my data and this is why I'm doing this webinar today because it's a really great question and I think it's something that some people will be able to make quite a lot of use of as well. |
| 04:07 | So let's jump across to an analysis project here and I'll show you exactly a little bit more what I'm talking about when it comes to making use of these setup parameters. |
| 04:18 | So let's take this example of chassis rake which I've got shown at the bottom here, this red line that's shown at the bottom here. |
| 04:28 | I should say as well, I'm going to do all the example today in MoTeC's i2 software. |
| 04:32 | MoTeC is what I tend to work in quite a lot when I'm doing freelance race engineering. |
| 04:38 | There's lots of other really good systems out there, whether it's Bosch systems, whether it's PI's PI Toolbox, whatever the different type of system you're using is, the same sort of idea applies to lots of different data analysis systems. |
| 04:52 | What we're talking about today won't apply so much to more entry level logging systems, it does tend to me something that's more used at the higher end of datalogging software so it's not something you're going to be using when you're first starting out with data logging but as you progress and want to make more use of some of the more advanced features, this is something you'll be using and I should also say this is not exclusive to MoTeC. |
| 05:16 | All of the higher end analysis software all offer a similar thing. |
| 05:22 | Essentially what we're doing here is we're linking a Microsoft Excel based setup sheet, doesn't have to be that but in this case that's what I'm going to use today. |
| 05:30 | An Excel setup sheet which my data analysis project can look at. |
| 05:34 | So let me just sketch that out, what exactly I mean by that just to make it a little bit clearer before we got any further. |
| 05:39 | So essentially if I've got my analysis software here, so I've got my whatever displays I'm looking at with my squiggly lines in my data that I'm interested in looking at. |
| 05:48 | And I've got my physical setup sheet here so this is what my mechanics will be filling out which is things like ride heights, cambers, whatever it is, all the stuff that we keep track of throughout a race weekend and what I'm actually talking about is taking a Microsoft Excel setup sheet which is taking either some or all of the physical parameters, so it doesn't have to be all of them, it depends if I want to make use of all of them in my analysis software and the idea here is that that information can then be sent to, in this case, i2 but as I said it can be any other type of software that offers a similar function. |
| 06:26 | I'm taking my physical setup sheet, I've got my Excel setup sheet which I'll go through in a section here. |
| 06:32 | And anything that's physically relevant in my electronic setup sheet that I can transfer across here and then the idea here is that each one of these rows is a different setup and as I want to update things throughout a race weekend as I make changes to the car, it means those settings that I've got set on the car can be transferred or automatically to my analysis project. |
| 06:53 | So I just want to give you guys a little bit of a run through of MoTeC's UI before I get any further just a very brief one. |
| 07:01 | Essentially my main analysis window here, this is where I'm going to put all of the displays, all the stuff I'm looking at. |
| 07:06 | So in this case I've got my speed, throttle position, brake pressure, steering angle, longitudinal G force and in this case my chassis rate which is one of the first things we're going to discuss as far as using these math channels. |
| 07:17 | Then down the side here I've got my logged data so here I've got some example logged data and I've got 2 different runs here so this area up here is one run and this area down here is another and by going through and selecting different laps, I can bring up different laps for whatever display I've got showing on my laptop screen. |
| 07:37 | I can also click here to put an overlay on so this is looking at the 2 fastest laps from 2 different runs for example. |
| 07:44 | So now I want to show you guys where I'm actually putting or where I'm getting this information from and where I'm storing it inside Excel. |
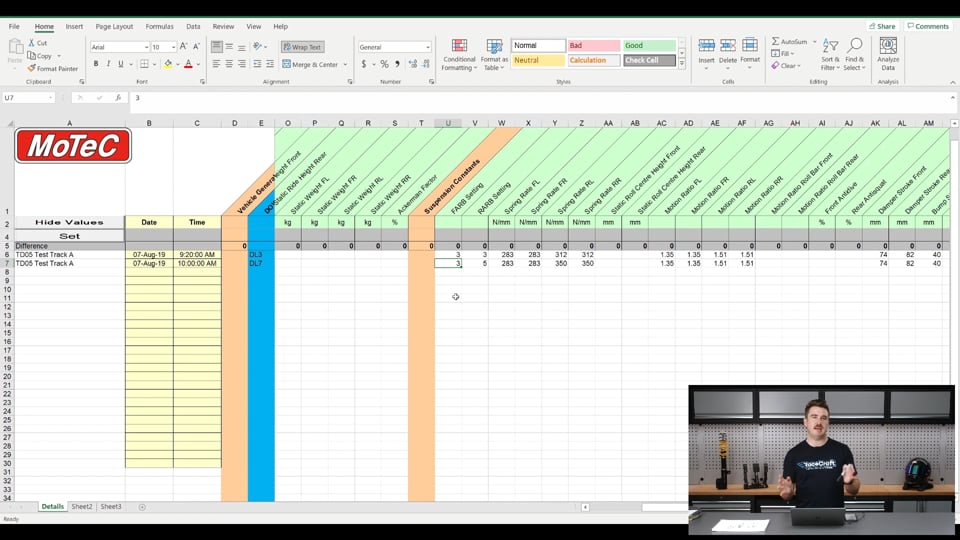
| 07:52 | So here is the Excel setup sheet. |
| 07:56 | So this is slightly modified from the starting point but essentially this is based on the base profile of a MoTeC electronic setup sheet so as you can see, I've got it logged here using normal Microsoft Excel, nothing flash about it. |
| 08:12 | This is, when you have i2, all of this stuff gets installed in your computer straight away, well once you've installed i2, then you've got access to this setup sheet and you can come through here and modify it in any way you'd expect to be able to modify any other spreadsheet, you can come and add columns for any specific stuff. |
| 08:29 | But essentially the general layout here is each one of these columns relates to a different parameter of the car. |
| 08:34 | And you'll see here, this is relatively basic, I've got just a really simple one set up here. |
| 08:37 | I'm not looking at a huge amount of parameters. |
| 08:40 | Here we've got the wheel base, in this column I've got the track width with the front and rear axle here, I've got some ride height measurements and as we come across here, what else have we got? I've got spring rates fitted to the car, we've got anti roll bar settings, motion ratios for each corner of the car. |
| 08:58 | Some information about damper settings, I've got the damper clicks in here as well. |
| 09:02 | And yeah that's about it, I've got my pit speed limit down here as well which is filled in. |
| 09:10 | A lot of this is the default information, I just came and quickly put this one together today but the idea here is that we've got each one of these rows is a different setup so you can see here I've got two different setups loaded for this car. |
| 09:23 | So I've got some information about what that session was so in this case it says test day 5 on test track A and then we've got some information about the date and the time for that log file. |
| 09:36 | So the important thing to understand is each one of these rows relates to a different setup of the car and now there's lots of different ways this can be managed. |
| 09:42 | You can have it so every single run you do on track, so every time you leave the pit lane and you come back in, you can make a new row for your setup sheet. |
| 09:49 | The way I've laid it out here and the way I tend to work, particularly when I'm working in smaller teams, is just to make a new row for every time I make a setup change on the car. |
| 09:58 | So you can see here I've got some information here, this DL3 and DL7 in the download column. |
| 10:04 | Now what I mean by that is that's my convention for how I tend to increment my downloads, I make one download for every outing on track. |
| 10:12 | You don't have to do it like that, that's how I find it easiest to keep track of my data in my run sheets just to keep things lined up and make it easy. |
| 10:19 | So I've got only 2 setups loaded into this setup sheet. |
| 10:24 | So what this implies is that I've made a setup change between download 3 and download 7. |
| 10:31 | So that's between the 3rd run on track and the 7th run on track. |
| 10:34 | So from download 3, 4, 5 and 6 I had the same setup on the car and then for download 7 I've done something different with the setup. |
| 10:41 | So let's actually make some changes to this just to make it a little bit different so we see those reflected in MoTeC's i2. |
| 10:51 | But essentially these values here are telling me, I've got, in this case I've said I've made the front ride height 55 and the rear ride height 137 whereas in the previous run it was 65 in the front and 137 in the rear. |
| 11:06 | So the idea here is that now I can use this data, it'll automatically propagate over to i2. |
| 11:12 | So what's actually happening there is i2, it knows to look at this setup sheet. |
| 11:15 | So it's actually linked to the chassis which is embedded as part of the information. |
| 11:19 | So let's actually go over and have a look at how that works. |
| 11:23 | Up the top here there's this little tab for the setup sheet and we can see here these values, each one of these rows is one of the columns from my Excel setup sheet. |
| 11:35 | So let's see if we can get it to update. |
| 11:39 | We've got down here our static ride height of 55 in the front and our 137, now let's come across back over into Excel and let's change that, let's say that's 75 in the front. |
| 11:53 | And we'll come back to this and you'll see it's updated to 75 there as well. |
| 11:58 | So hopefully that gives you a pretty good idea of how that works. |
| 12:01 | Essentially every time I'm doing a physical setup change in the car, I'm making a new row in my MoTeC setup sheet then that automatically propagates over to i2 and I can then make use of these values inside my analysis software. |
| 12:13 | So in this particular case, what we've got going on, the thing that's going to be relevant to the pitch of the car. |
| 12:22 | So I've got my chassis rake channel down here which is just a calculation I'm doing in the background using those static ride height positions, those ride heights essentially are taken from arbitrary points on the car but it's something I can relate back to the physical ride height for this particular car and then I can do a calculation on the dynamic rake that I've got on the car so basically if I'm looking at the front and rear ride height and then based on how much the damper pots are moving on this particular car, that is taking into account how much the dampers are moving via the motion ratio to the wheels, that tells me how much the wheels are moving at the centreline of each axle. |
| 12:54 | Then I can do some math to work out how the rake is changing. |
| 12:57 | The rake is something that's really important on cars that have a lot of downforce. |
| 13:01 | It's something, particularly cars that have a lot of downforce coming from the floor, the floor is really really sensitive to the pitch angle or the chassis rake angle of the car so that's why I'm using it in this particular analysis here. |
| 13:14 | So let's, because I've changed one of these rows, let's just come back here, I've got download 3 and download 7 written here and I've got 2 different ride heights. |
| 13:25 | Let's see if this updates correctly. |
| 13:27 | You've got here, you'll see in this, the data I've got selected, we've got download 3 and download 7 shown here so if I select these 2 different ones. |
| 13:35 | Obviously I've made this massively different and it's not really a realistic number at this point but you can see I've got a huge offset between my chassis rake angle, obviously I've put imaginary numbers in there for the ride height but you can see by changing my static ride height on the car, my data analysis package can automatically update the real value that I want to use to make my calculation more valid or make it valid at all because it wouldn't really be valid otherwise. |
| 14:01 | So let's come back and put that at a more reasonable value there and we'll come back and it should, it'll take a second but it will propagate and be corrected, there we go. |
| 14:13 | So that's giving me a way to understand how much the car's squatting, what the angle of the chassis is with respect to the road surface as I move around the track. |
| 14:26 | So as I said, every other high end, or not necessarily high end but moderate to high end software will give you a similar feature, sometimes it's managed through Excel which is how I've used it here. |
| 14:38 | Sometimes it can be linked to a team's own software if a team has their own setup tracking software it can be linked to that so there can be 2 way communication between the analysis software using an API or something similar to communicate with your own software. |
| 14:53 | There's lots of different ways it can be managed but you can hopefully see there how it's a really really powerful tool. |
| 14:58 | The other thing I want to talk about here is I should show you exactly where this is stored, so this is just stored in a default location as I said, there's a template you can base your first setup sheet if you're MoTeC's i2 anyway. |
| 15:12 | You can see the path here where I've got everything stored which is basically, each MoTeC project has a space for an Excel setup sheet which is stored in that location so that's where I've got it stored in the default location and it says here we've got this 488 chassis 42. |
| 15:31 | So the reason that's important, that means, that's actually the name of the setup sheet. |
| 15:35 | So I'll got back here and you should see at the top here, you can see 488 chassis 42. |
| 15:40 | That is really important because the idea here is obviously if we're looking at multiple cars, each car's going to have a different setup on it so the idea is you've got one of these setup sheets for each car. |
| 15:50 | So you can have multiple of these setup sheets defined in your computer and depending on what the data source is, it'll automatically point to the right setup sheet depending on which chassis you're looking at. |
| 16:00 | So let's see if we can see some information about that. |
| 16:03 | I'm just going to open some data here. |
| 16:08 | So we've got the vehicle ID here so this is the column that's really important, so you can see that matches, that's 488 chassis 42 so the idea behind that is when we've got our logger configuration that's set inside our logger, we would have that vehicle ID set as that value and that means as long as our setup sheet has the same matching value to it, it'll automatically point to the right setup sheet depending on which chassis you're using. |
| 16:35 | Obviously that becomes really important that your logger configuration is right as far as having the right vehicle ID assigned to the right logger and the right chassis or the right car. |
| 16:42 | But after that it becomes really seamless. |
| 16:45 | It handles all the stuff in the background for you. |
| 16:48 | The other thing I wanted to point out is how it knows which of those rows to look at. |
| 16:53 | So what's going on here is you can see, the way MoTeC's i2 handles it is we can see we've got these values for date and time so here we've got the date up here, 7/8/2019 and then we've got some time information that goes with it as well. |
| 17:10 | So these values are really critical, these values are coming automatically from the logger every time, sorry automatically when the data's downloaded so you can go and modify those after the fact but as long as everything's setup up properly inside the logger and inside the computer that you're doing the downloads with, then every time one of those log files is downloaded it'll automatically assign the correct time and date to it and that becomes critical for matching the right row on the setup sheet as well. |
| 17:35 | So let's have a look here, let's have a look for download 3 we've got 9:21.59 AM. |
| 17:42 | Let's see what row we've got fitted on here. |
| 17:44 | So again we've got the right date in the data column here and we've got the time here as well. |
| 17:51 | So I think we had 9:21 in the date column on the actual log data and I've got 9:20. |
| 17:55 | So the reason, how it lines these up is it looks for the most recent setup sheet row that aligns with the data source so my normal convention, and typically when I'm in a small team and I haven't got software that's managing this automatically, all I do is look at the log file, so at 9:21.59, so I just make it really close but just before that download. |
| 18:20 | That way it knows which row to look at. |
| 18:22 | So in this case I've got 9:21.59 and in my setup sheet I've got 9:20 so just almost 2 minutes before that so there's not going to be any other downloads that are within that scope and the idea here is that the next download will obviously be quite a lot later than that, maybe a few minutes later or sorry 5, 6, 10 minutes later, whatever it ends up being and that way my setup sheet will know which value to look at. |
| 18:46 | The next one here is 10 AM so let's see what value I've got set up here. |
| 18:51 | It's 10:31. |
| 18:53 | So because I'm only looking at 2 little pieces of data here, I don't have to have these times sitting too close to each other. |
| 19:03 | In reality if I was using this in a real situation I'd probably put something like 10:31 written in there rather than 10 o'clock. |
| 19:10 | But essentially it looks for the most recent previous data set and it aligns it based on the time and the date to know which one it's looking at. |
| 19:18 | So just to make that really clear, if I'm here, if I'm going to look at just that download 3, we can see we're looking at download 3, that's the data, the primary data source it's looking at. |
| 19:29 | And if I go ahead and then select something from download 7 which we can see download 7's written at the top here. |
| 19:35 | I go back into my setup sheet, it's now looking, I can see it's looking at the correct value of download 7 so that's just one way you can check you're actually looking at the right one there as well. |
| 19:43 | If you have got values that don't line up or don't make sense to you it's almost always because you've got either the time or date wrong in here. |
| 19:49 | It does take a little bit of playing around to figure out how it works and how to make the most use of it for you. |
| 19:54 | I usually just make it round it to the nearest previous minute or something like that to make sure each data source is looking at the correct row on my setup sheet. |
| 20:03 | So now let's go through and have a look at a couple of examples. |
| 20:07 | I've already talked about the example of pitch which is what we're looking at here at the bottom here in red which again is just taking those live ride height values from my setup sheet and doing some math in the background which isn't really important, it's just, I'm basically taking those values, doing something with them to then spit out a chassis pitch or chassis rake angle value. |
| 20:27 | Another thing I make quite a lot of use of, particularly when I'm dealing with high downforce cars is looking at bump stop gap. |
| 20:34 | So what do I mean by bump stop gap, in fact let me just sketch it out to start with. |
| 20:37 | So I can show you guys exactly what I'm talking about. |
| 20:41 | So typically on a coilover you might have say something like this, this is our damper at the bottom and then our shaft with our top hat and everything. |
| 20:53 | So normally there would be a spring mounted here, I'm not going to draw it, just to keep things a bit clearer but this is our platform that our spring will sit on down here. |
| 21:02 | Spring will be sitting in this area. |
| 21:04 | Now one of the things that you'll make quite a lot of use of in high downforce cars is bump stops and bump stop gaps so what I mean by that is if we've got our bump stop sitting here. |
| 21:15 | This is our bump stop gap when this thing is at full droop. |
| 21:21 | Now one of the things you'll be tuning quite a lot in our high downforce applications is this gap when the thing's actually running on track so let's draw another, so this is when it's sitting at full extension. |
| 21:30 | Let's say we've got, now we're running on track and now our top plate may be sitting here and we've got our normal bump stop here. |
| 21:36 | So when the car's sitting at ride height, this here might be your gap which is obviously a lot less. |
| 21:41 | Now the thing that you'll be tuning quite a lot is the height of this gap when you're sitting at ride height. |
| 21:47 | The idea here is that depending on, by tuning that gap you're going to define when the bump stop's actually going to come into contact with the damper and when the bump stop's actually going to start to be active and engaged. |
| 21:56 | So one of the things I spend quite a lot of time doing is tuning bump stop gaps which is essentially adding small packers in here, like this to tune when that bump stop wil be engaged. |
| 22:08 | Essentially it's just giving you a quick way of doing that. |
| 22:10 | So by adding a little packer in here, let's say that's for argument's sake 5 mm high, this one here, that means that bump stop's going to engage 5 mm earlier than it otherwise would. |
| 22:20 | That's really important for again controlling the inclination of the chassis at different points on track but also as far as when the bump stops are engaging, you don't want, you often don't want them engaging mid corner, well in some cases you don't. |
| 22:34 | As far as changing the stiffness really quickly as the bump stop engages and disengages over and over but essentially using packers or what we call packer gap is what I'll be using to tune the bump stops quite a lot. |
| 22:46 | So let's have a look at the setup sheet again and let's see what I've got selected here for the bump stop gap. |
| 22:52 | So these rows here, I've got my damper stroke set up so that's my front and rear damper stroke so you can see I've got 74 in the front and 82 in the rear. |
| 23:02 | So that's this total value that I've got set up on this diagram so that would be my total available damper stroke. |
| 23:12 | And then after that I've got the height of my bump stops in these columns here so in the front, the static height of the bump stop I've got fitted to the car, the front is 40, the rear is 30 and then I've got my packer stack. |
| 23:25 | So what this is saying, I've got 74 mm of travel, I've got 40 mm high bump stop plus 12 mm of packer in the front. |
| 23:35 | So that means I've got 52, I've got 52 total height of my bump stop with the packer, I've got 74 mm travel so I've got about 22 mm of available stroke before the packers and the bump stops will become engaged and become active. |
| 23:52 | So essentially that's all I'm doing in my MoTeC project here, if I just go across to my dampers tab, I've got this worksheet set up here which is bump stops. |
| 24:03 | So essentially each one of these displays is showing a very similar thing but just in different ways. |
| 24:09 | Let's start with the really simple stuff with the time/distance plot. |
| 24:12 | Essentially that calculation that I'm doing the whole time is looking at my available damper stroke, my bump stop heights and just telling me whether or not the dampers or the bump stops are engaged at that particular point on track. |
| 24:25 | So the math I've got here is obviously, let's go from the top, I've got my corrected speed, my throttle and my brake, my steering which is just a nice reference for understanding what's happening with the car, what the driver's doing with the car at that point. |
| 24:35 | Probably want to sort of go back and cross reference it, I usually have those inputs just showing up there to give me a little bit of context but what's happening here is any time this bump stop gap value which I've got 1 for the front left, front right, rear left and rear right so one for each corner of the car here. |
| 24:50 | Each time one of these lines here is below 0, that means that the bump stop is active or the bump stop is engaged. |
| 24:56 | So you can see just a very faint line sitting through this section here which is my 0 line. |
| 25:01 | So you can see in this section of the track here we've got the front left bump stop is quite engaged through this section of the track. |
| 25:08 | Then as we move down, you can see we're in a straight here, we can see the car speeding up. |
| 25:12 | You can see the bump stop gap is decreasing, decreasing, decreasing in the front and then later in the lap, both the front right and the front left bump stops are becoming engaged in different sections of the track as well. |
| 25:23 | Now this slope that you see here, this is really important to understand because this is the, we can see basically that damper is closing up on the bump stop gap and that's happening because of the downforce as the car's speeding up. |
| 25:34 | So as the car speeds up, the downforce changes or increases with the square of the velocity. |
| 25:38 | That means that, obviously if you're speeding up they'll get more downforce but you'll also get more drag to go with it and that's what we're seeing, that bump stop gap close up as the car goes faster and faster in a straight line as the suspension compresses so that's what we're seeing there. |
| 25:52 | We can see we're almost touching the packers at that point so let's say the front left. |
| 25:55 | At this particular point on track the car's actually got a slight right hand corner so it's slightly exaggerated but just to give you an idea, at 250 km/h there, we are just starting to engage that front left packer. |
| 26:05 | So that's what that data looks like in terms of the squiggly lines but there's some other ways we can understand this data as well. |
| 26:13 | I've got a track map for each corner of the car here and essentially this is a bit of a heat map which tells us how much packer engagement we've got at each point on track and again it's just another really visual way to understand what's happening with, in this case the packer gaps or the bump stop gaps at each point on track. |
| 26:32 | Gives you a little more context. |
| 26:34 | For some people this makes a bit more sense to look at it in terms of a track map. |
| 26:37 | I certainly find sometimes it's useful. |
| 26:38 | Once you know a circuit really well, a time/distance plot can be really helpful. |
| 26:41 | You know just from the shape of the speed trace, you know what part of the track you're looking at based on the speed trace but maybe if you're not as familiar with that particular track, a track map can be really useful. |
| 26:51 | But in short what we can see here is that on the entry to this turn in turn one, we've got the front left packer, we've got, obviously this is arranged into corners, that's front left, front right, rear left, rear right. |
| 27:01 | We can see the front left packer up here is starting to engage pretty heavily as we enter turn 1, then again as we come down to this turn down here and again in this right hander we've got the front left packer engaging quite heavily. |
| 27:12 | The front right is only starting to touch down here but this is only because it's quite a bumpy track at this particular circuit. |
| 27:18 | Then we've got, as the car turns left in this section of track, it makes sense that the front right will become compressed and we've got the front right engaging here. |
| 27:25 | Again we've got it touching down here a little bit and in this left turn, this fast left hander down here, we've got the front right engaging here. |
| 27:32 | We can see that the rear packers are engaging quite a lot more on the straights and we're doing that intentionally in this particular car to keep the ride height in a particular window, trying not to get the rear ride height too low. |
| 27:45 | We can see another way of looking at it down here is in the bottom plot down here, essentially I've got all 4 corners of the car stacked on top of each other so each one of these white bars here is a corner of the car, front left, front right, rear left, rear right and each one of these red lines, that's not telling us how much engagement we've got so much, it's just telling us with a boolean, a 1 or a 0. |
| 28:08 | Is the bump stop engaged or not? If it's engaged it'll be red, if it's not engaged, it'll be white. |
| 28:12 | So again it's just another really quick visual reference for understanding how engaged the bump stop is. |
| 28:18 | We can see pretty clearly at this point on track, the front right has got some pretty heavy engagement with these big red blocks. |
| 28:23 | And if I want to see it in a little bit more detail about that, it's pretty clear, I can come up here and see the logged data as well. |
| 28:30 | We can see that it makes sense with what we're seeing there. |
| 28:33 | One of the other, let's have a look, I wanted to look at the roll angle as well because I think that's got some useful stuff in it. |
| 28:43 | I've got some other ways we can make use of setup sheet values here. |
| 28:47 | In this case I've got the actual settings that I've got set to the car shown on the left hand side here. |
| 28:54 | So what this is saying is the front anti roll bar, so this particular car has, it's got blade adjustable anti roll bars, you can adjust each side of them individually. |
| 29:02 | So MM medium medium on both sides and HH means hard hard on both sides. |
| 29:08 | So the front has got medium medium, the rear has got hard hard and these are the springs I've got fitted to the front axle and the rear axle respectively. |
| 29:15 | Now if I click on the alternative data here, the overlaid data, I've got some information here about roll angles and stuff that I'm doing, I don't want to fixate too much on that. |
| 29:24 | It's actually the fact that I've got these different setup values coming through onto my data. |
| 29:31 | So here I can see between these 2 runs, I've got some really clear setup differences that I want to dig into. |
| 29:37 | So I've got the front anti roll bar settings are the same between both runs but on the rear in the main data I've got hard hard and in the overlay I've got medium medium set on the anti roll bar. |
| 29:45 | And down here I've got the same springs in the front but different rear springs. |
| 29:49 | So again if you've got, in this particular case I'm not actually using those values for any calculations, well not in this view anyway, it's really just a reference for me to understand if I'm doing through and looking at roll gradients or roll angles, it's really nice to be able to see, without having to flick back to the setup sheet, I can see straight away in here, I might be looking for why I've got more roll on one end of the car in one run with respect to another and I can come back here and just have a look at the different spring rates in the anti roll bar settings to understand if that might be why we've got that difference there. |
| 30:17 | So again that's just another way I make use of them. |
| 30:20 | There's lots of other uses you can use this stuff for, you could use it for each run that you go out on track, you could put the start fuel, or any time you add fuel to the car, you could put that in your setup sheet. |
| 30:32 | Then using your fuel used channel in your data, you could actually be calculating how much fuel you have in your tank at any point throughout a logged file. |
| 30:40 | That's another really common way of using it. |
| 30:43 | Another way I've used it in the past is making use of damper calculations. |
| 30:46 | So for example if you have your damper dyno information, if you can put that in your setup sheet and parameterise it so you can bring that into your main analysis project, then you can use things like the damper velocity to look up what the damper forces should be. |
| 31:03 | So it's a huge topic, certainly in some really high end cars and high end racing, it's something you use a lot, you're using a lot of really complicated formulas, a lot of really complicated information and pulling that into your logged data and doing a lot of heavy calculations. |
| 31:18 | At the other end of the spectrum at the club level, maybe it's just important for you to start with the simple things, things like ride height or the amount of fuel you've got in your car. |
| 31:27 | Again it's just a reference for you to be able to understand, get a little bit more detail out of your logged data. |
| 31:31 | So guys if you guys have got any questions about this, whether it's about linked setup sheets like I've been talking about today, about setup, race engineering, whatever it is, chassis tuning in general, happy to answer those, if you chuck those through to the guys, they'll put them through here on my laptop in a second and I'll get straight onto those questions. |
| 31:48 | There's a couple of other things I wanted to discuss, one of them is the concept of what we can enumeration which is actually what I'm making use of here with this MM and hard hard, sorry medium medium and hard hard. |
| 32:00 | What I've got shown here from the anti roll bar tuning, that's coming from these values here, my front and rear anti roll bar settings. |
| 32:07 | So the way this is working, I've got essentially values matched to text or enumerated as text. |
| 32:18 | Enumerate essentially you can think of it like a mask. |
| 32:20 | So the way I'm defining this is a 3 means medium, sorry medium and medium on both sides. |
| 32:28 | A 4 means medium hard and a 5 means hard hard. |
| 32:31 | Now the reason I can't write MM or HH directly in my setup sheet here is because for i2 anyway, it can't bring strings or what we call text values through the setup sheet, you can only deal with numerical values. |
| 32:45 | So what I'm doing is taking that numerical value for my setup sheet and then what I'm calling an enumeration, essentially a mask gets put on that to put it in a more usable format for the end user. |
| 32:55 | So I'll show you what's going on there. |
| 32:57 | All you need to know to start with is I've got my front anti roll bar there. |
| 33:00 | For this run I had 3 on the front and I had 5 on the rear. |
| 33:04 | When I come through to i2 I can see these, not coming through as far as numbers, they're coming through as far as numerations. |
| 33:10 | So let's have a look at how they're defined. |
| 33:13 | So if I go to my chassis down here we've got all of the different chassis math that I'm using for this particular car. |
| 33:21 | And then as I come into the numerations we can see how these are defined here. |
| 33:24 | So essentially it's putting out this channel called FARB or front anti roll bar setting. |
| 33:30 | So I've got the name specified here and then I've got the mapping here between the enumeration and the value. |
| 33:38 | So you'll see 1 in the setup sheet which means soft soft, medium medium is 3, 5 is hard hard, 4 is MH. |
| 33:45 | So just to make that really clear, if we come through back and put, let's put a 4 for argument's sake here. |
| 33:54 | Save that and this should, it usually takes a second to update but now you'll see I've got medium hard on the rear anti roll bar setting in my main data here. |
| 34:05 | So you can see how that all propogates through and I think it's definitely a valid tool, it does speed things up for you without having to go between a whole lot of different softwares all the time if you want to check settings. |
| 34:21 | The other thing I should mention as well, I did mention this before, these can get really sophisticated and complicated, you're not always looking at Excel, you are sometimes looking at an external software as well. |
| 34:31 | Whether it's something from a supplier or whether it's something you've written yourself, lots of these softwares, MoTeC as an example, you can use your own APIs which is essentially just an interface to be able to help you interface your data analysis software with an external piece of software, essentially helping you to communicate back and forward. |
| 34:49 | OK guys I'm going to just go see if we've got any questions in here so I'm just going to flick across to the questions view. |
| 34:57 | We have got a couple of questions, alright fantastic. |
| 35:00 | Suhas Govinderaj, OK Suhas has asked, what differences should one consider while setting up a front wheel drive car and a rear wheel drive car? Parameters like alignment and weight balance, what is the ideal position for mounting a G sensor in a front wheel drive car? Front wheel drive will have more wear on the front tyres, can you give any tips on tyre management for front wheel driven cars? Yeah you've really packed a lot into that question there Suhas so let me try and attack it piece by piece there. |
| 35:24 | So let me start with the parameters, you've said alignment and weight balance. |
| 35:28 | Yeah so front and rear wheel drive car, very different way the tyres are being used. |
| 35:32 | As you've made the point there, typically in a front wheel drive car, the front tyres will often be really over saturated. |
| 35:39 | Some of this is coming from, usually when people are using cars for motorsport, that's usually because they're based on road cars so you're essentially inheriting some of the layout of an original road car which was designed for something really different for what you're using it for. |
| 35:53 | Let's take the typical hot hatch front wheel drive, these things, while they might be a little bit sporty for the road, they've still got to typically meet exactly the same demands that any other garden variety car will be on the road, they're trying to be comfortable to drive, they're trying to maximise cabin space, both for people and bags and stuff like that, they're not typically aligned with what we're trying to do for the racetrack. |
| 36:16 | The reason I say that is because you end up with things like a really heavy front weight distribution for example and that's because they're packaging things like the engine and the transmission, all that stuff into the front, getting it as far ahead of the car as possible in order to make more room for people on the inside of the car. |
| 36:32 | Now that's great for a road car manufacturer, it tends to hurt us in some situations when we're racing our cars so as you say there, the weight balance. |
| 36:42 | Largely the weight balance or the weight distribution of the car, you're stuck with what you've got, unless you're going to start messing around with moving big components like engines and transmissions and stuff like that, you're going to have the weight balance or the weight distribution that you've got from factory. |
| 36:56 | So typically you'll find the front axle of the front wheel drive will often be over saturated. |
| 37:00 | Just because it's got all that stuff in the front of the car and that does tend to make the limit handling understeer typically. |
| 37:08 | You can obviously always tune around that stuff but just fundamentally it makes it, when you've got one end of the car over saturated. |
| 37:15 | The thing I would say about that is you end up getting the opposite effect at the rear end of a front wheel drive car where quite often the rear end of the car is quite lightly loaded as a result. |
| 37:27 | But you can actually get into a situation with front wheel drive race cars where the rear axle is so slightly loaded it actually becomes difficult to get enough temperature into the rear tyres to get grip so this is why you sometimes end up in a situation with a smaller either overall height and/or narrower tyre on the rear of a front wheel drive car. |
| 37:44 | It'll actually usually end up working better or being better balanced like that. |
| 37:47 | The reason is if you've got the same tyres front and rear or a square setup, same tyres on all 4 corners of the car in front wheel drive, you'll often struggle to get any amount of tyre temperature into the rear which can make the rear really, so low grip or slidy so often you end up with a staggered setup on a front wheel drive car. |
| 38:06 | It's usually the opposite on a rear wheel drive car, you're usually looking for more and more rear traction, typically in a front engine rear wheel drive, that's also for the same reason you end up with a staggered setup, it really comes down to the amount of energy you're inputting into the tyres. |
| 38:21 | Front wheel drive you've got a whole lot of weight over the front, you're turning, you're driving, you're doing everything on the front axle, the rear's just really there along for the ride. |
| 38:28 | On the rear wheel drive car you might have plenty of weight on the front axle but you're typically quite dry limited, particular at low speeds, so you'll typically be looking for larger and larger rear section of tyre to get more grip out of it. |
| 38:38 | Now your question there about where to mount the G sensor in a front wheel drive car, that doesn't really matter whether it's front wheel drive or rear wheel drive, the ideal place to mount the G sensor is at the centre of gravity of the sprung mass. |
| 38:48 | So what I mean by that is just the centre of gravity of the car or you can think of it as the, pretty simply as the car or the chassis itself. |
| 38:54 | So the reason for that is you end up with getting rid of some of the translation errors by having, let's say if you've got your, a typical situation might be if you've got your G sensor built into your logger which might also be your dash, if you've got that mounted too far ahead of the centre of gravity of the car, essentially the accelerations that are acting on that logger or that G sensor are going to be skewing or sorry yaw accelerations that you've got on the car are going to be skewing the results. |
| 39:20 | What I mean by that is as we head into the corner obviously we've got the car yawing about its centre of gravity or somewhere close to its centre of gravity and those yaw accelerations are going to affect the lateral accelerations that you measure on the G sensor so that's why you typically want to mount any G sensors you've got as close to the centre of gravity as possible. |
| 39:42 | It really doesn't matter whether it's the front or rear wheel drive car. |
| 39:46 | OK questions from Jeffis2K, Jeffis asks, any experience with AiM RS2A and RS3A beta? I'm fed up with using pen and paper separate from my logger, would love to know if there is a similar enumeration capabilities as being shown? So what Jeff's talking about there is I think the Race Studio 2 vs Race Studio 3. |
| 40:08 | So as far as, AiM is just another logger company, they make more than loggers, they make all sorts of electronic equipment for race cars but Race Studio 2 is, from what I understand is their current analysis software so similar to what I was showing with MoTeC there, it's just a different brand, a competitor's brand to that, that you use to analyse the actual data. |
| 40:30 | Race Studio 3 which from my understanding as you're saying is still in beta. |
| 40:33 | What I mean, it's just not made for public release yet, well it is available publicly but it's not officially supported as their official analysis software. |
| 40:40 | I don't actually know on any enumeration for AiM. |
| 40:45 | I will say while I have used AiM, I haven't used it to this sort of level where we're doing setup sheet linking or anything like that. |
| 40:52 | I don't know if enumerations are part of their package or not, you would have to contact AiM, sorry Jeff I'm just not sure on that because I haven't used the AiM Race Studio analysis to that sort of level where I've actually had to use numerations at all in the past. |
| 41:07 | OK another question from Suhas, MoTeC calculates power and torque using the amount airflow through the engine, can you mention the formula used to do that? No I can't, I don't know what it is. |
| 41:18 | I don't actually know if they expose that, it may well be included in their help file. |
| 41:21 | I don't actually know if they make that exposed to the user but it's just something you'll have to contact them to see what assumptions and what formulas they're using for that, I don't know off the top of my head sorry. |
| 41:34 | Shane Plohl, I assume you can do all the Excel logic etc inside the setup sheet and do you have any examples? Nothing that I can show you and what I mean, a little bit, I've had to strip out a whole lot of sensitive information from real cars I've worked on in the past. |
| 41:49 | For obvious reasons I don't want to share that stuff in public but yes you can absolutely handle all of the log in Excel. |
| 41:57 | It depends case by case whether it makes more sense to handle internally within i2 or handle it within the Excel sheet. |
| 42:06 | Taking one step back from that and further again, sometimes I try and handle all of that, any logic that's possible to handle inside of the logger with internal logger math rather than, just to sort of unload the Excel of any extra logic. |
| 42:18 | What I mean by that is when you end up with really heavy Excel sheets, really complicated Excel sheets. |
| 42:23 | Let's say an example might be to calculate the different bump steer curve for different suspension settings. |
| 42:31 | So something you'll see in for example V8 Supercars where the current generation of V8 Supercars anyway where the suspension's still quite adjustable. |
| 42:39 | What we do, we've got all of the different suspension configurations, as in the different hard points, so all the different arms can be attached to, we've got a different base bump steer curve that we know each one of those combinations has. |
| 42:51 | So you might have many many situations of different suspension geometries that you've got and each one of those has a unique bump steer curve and the idea here is that I can be doing that logic in some of my Excel setup sheets and then applying offset for my static toe setting to understand what my real toe angle is on each corner of the car live at any point throughout the lap. |
| 43:15 | So in that particular case you might have that library of bump steer curves stored in i2, you might have it stored inside Excel, I've worked in the past where I've had it stored in Excel. |
| 43:26 | The problem with that when they get really heavy and you've got a whole lot of information stored inside of them, when those Excel sheets get really large and particularly when they've got 100s and 100s or even 1000s of rows of data and different setups in there, they tend to get really slow and clunky. |
| 43:39 | Excel isn't, I wouldn't say it's famous for being efficient when it comes to managing a huge amount of data. |
| 43:46 | So that would be my recommendation if you start getting really really heavy data with lots of heavy calculations, lots of curve fitting, polynomial fitting, stuff like that and it's stored inside your Excel setup sheet, it can make it a little bit unstable. |
| 43:59 | Certainly best case it gets slow, worst case it gets so unstable that you end up getting crashes and losing data and it just really slows down your analysis process. |
| 44:07 | Sorry I haven't got any particular ones I can share with you right here but hopefully that gives you a little bit of an insight to it. |
| 44:17 | It really depends on the situation whether I want to abstract that logic into the logger, whether I want to do it in the Excel or whether I want to do it in my analysis project. |
| 44:24 | It really depends at which stage throughout the process I'm going to want to modify that. |
| 44:28 | So guys, that's all the questions we've got. |
| 44:30 | As always guys, keep an eye out for future courses that are coming out, keep an eye on our socials as you guys know, we always put up lots of really tech heavy content across all of our social channels. |
| 44:41 | Thanks very much guys, I hope we see you guys in a future webinar. |
Timestamps
0:00 - Introduction
0:30 - Examples
3:10 - Purpose of a setup sheet
5:20 - Excel setup sheet linked to analysis software
6:50 - MoTeC UI run through
7:45 - Excel spreadsheet walkthrough
9:35 - Download increments
11:35 - Updating i2 from Excel
14:25 - Every moderate to high end logging system will have the same
14:55 - Where is the Excel sheet stored?
16:45 - Time/date linking
20:00 - Pitch example
20:25 - Bump stop gap example
28:35 - Roll angle example
30:20 - Available fuel example
30:40 - Damper calculations example
31:50 - Enumerations
34:50 - Questions


