099 | MAF Rescaling with HP Tuners
Summary
If you’re reflashing an OE ECU that relies on a mass airflow sensor, then all of the ECUs load calculations are based off the measured air mass from the MAF sensor. Any time we make changes to the intake system, airbox or MAF sensor itself, this may require the MAF calibration to be corrected in order to ensure that the MAF is reporting the correct values. In this webinar we’ll discuss how we can do this in the HP Tuners software on a GM platform.
| 00:00 | - It's Andre from the High Performance Academy, thanks for joining us for this webinar where we're going to be looking at MAF rescaling using the HP Tuners software and this will be relating specifically to the GM tuning or GM PCMs. |
| 00:16 | Mainly the ones that we're interested in here are the PCMs used on the GM LS V8 engines. |
| 00:24 | So what we're going to be looking at is what the MAF sensor does, why it's so critical to the operation of the PCM and the resultant tune and then we're going to have a look at how some errors can creep in to the MAF scaling and then finally of course what we need to do in order to correct our MAF scaling and get our tune on point very quickly. |
| 00:49 | Now this is probably an area where a lot of tuners overlook, they don't really understand how important the MAF sensor is to the way the PCM works and if we don't have this right, it's still possible to fudge the tune and get the results in terms of air/fuel ratio that we want but it's going to be, as I've said, a fudged tune, it's not going to be right, it's not going to be how GM factory engineers intended. |
| 01:25 | What we're also going to end up doing, if our MAF scaling is incorrect, the PCM doesn't really know exactly how much air is entering the engine and this is going to affect both the fuel delivery, the ignition timing that is being delivered to the engine. |
| 01:41 | What we'll find is that when we spend the time and get our mass airflow sensor scaling correct, we're going to find that all of a sudden, everything to do with the tune just falls into place much easier. |
| 01:56 | And it doesn't really take very long to adjust our MAF scaling. |
| 02:00 | If we do that, we'll find that our whole tune is going to be much quicker and the finished product is going to be much more accurate. |
| 02:10 | OK so let's talk about what the MAF sensor is or mass airflow sensor. |
| 02:13 | As its name implies and as most of you would probably already be aware, the mass airflow sensor is simply a sensor that tells the PCM or ECU if you like, the mass of air entering the engine. |
| 02:28 | Now this is really the critical aspect to the operation of most OE ECUs. |
| 02:33 | First of all, unlike aftermarket standalone ECUs that calculate the mass of air entering the engine, using the speed density principle, the majority of OE ECUs, certainly the ones we're talking about here, will directly measure the mass of air. |
| 02:52 | Now the reason they do this is if they accurately know, if the PCM accurately knows the mass of air entering the engine, and it accurately knows the mass of fuel that the injectors can supply for a given pulse width, it becomes very easy for the PCM to accurately achieve a certain air/fuel ratio. |
| 03:15 | So if we have a target air/fuel ratio, the PCM knows what mass of air is entering the engine and it knows what mass of fuel it can supply, it's very easy for the PCM to accurately calculate the required pulse width to achieve our desired or commanded air/fuel ratio. |
| 03:35 | So it's all about being able to really accurately control the fuel delivery and of course from the OE standpoint the key there is they want to be able to achieve minimum emissions or meet emissions standards. |
| 03:52 | So that's why the mass airflow sensor is so critical. |
| 03:56 | All of the calculations that the PCM does are based around the mass of air that that mass airflow sensor is telling the PCM is entering the engine. |
| 04:07 | Now when the car is first calibrated by the GM engineers, the mass airflow sensor is calibrated very accurately on a flow bench and it will be calibrated alongside the entire intake track. |
| 04:23 | So all of the intake plumbing, the air box, the air filter etc. |
| 04:27 | Now in that kind of format we would expect, understandably the mass airflow sensor scaling to be accurate. |
| 04:35 | What happens though as soon as we get into the aftermarket is we rip all of that stuff off because it's all restrictive and it's going to hurt our power and we go and modify the intake track, we fit an over the radiator cold air intake or a better flowing airbox or a pod filter and perhaps we modify the intake plumbing from the mass airflow sensor through to the throttle body. |
| 05:00 | All of this adds up to affect the accuracy of the mass airflow sensor calibration. |
| 05:07 | And hence now we're going to get into a situation where the PCM is being told the incorrect amount of air is entering the engine and this can end up with the PCM making the engine run richer or potentially leaner than our commanded air/fuel ratio. |
| 05:26 | So if this is the situation, we need to do something about it. |
| 05:29 | And we need to correct our mass airflow sensor scaling. |
| 05:34 | First of all, how do we know if our mass airflow sensor scaling is incorrect or inaccurate? Well we obviously need to be using the scanning software in order to help us highlight this. |
| 05:49 | There's a couple of ways that we can tell. |
| 05:51 | First of all, we're probably going to want to have a wideband air/fuel ratio sensor connected to the HP Tuners interface and this is going to allow us to scan the actual measured air/fuel ratio or lambda value straight into the VCM scanner. |
| 06:09 | So if we're looking at this, we've got this data entered into the scanner, what we're looking at is the PID that's called commanded air/fuel ratio or equivalence ratio and what we want to do is essentially see the measured air/fuel ratio always being equal to our commanded air/fuel ratio. |
| 06:31 | Now remember that's the key, if the PCM, just reiterating, if the PCM knows the mass of air entering the engine, and the size of the injectors, it can accurately calculate the required pulse width to achieve our target and hence our measured air/fuel ratio should always be very very close to our commanded air/fuel ratio. |
| 06:50 | So if we're getting a discrepancy in there, this is indicative that our mass airflow sensor scaling could be innacurate. |
| 07:01 | Now another tip as well that we can always look at is what our short term and long term fuel trims are doing. |
| 07:08 | Now it's not uncommon to see even a bog stock factory car with some amount of trimming in the short term and long term fuel trims and after all that's what they're there for, that's why they're there, to make sure that any error that creeps into the system is accounted for. |
| 07:27 | But if we're seeing quite significant trims in our short and long term fuel trims, again this is indicative that we may have a scaling problem. |
| 07:35 | Now I'll just give you a really quick example here because it's one that I'm really familiar with. |
| 07:40 | Here in the Southern Hemisphere, I do, or used to do a lot of tuning on the Holden Commodore and HSV product, really it's in the US market, Pontiac, GTO and they're obviously equipped with the LS V8, so LS1, 2 and 3 depending on the generation we're talking about. |
| 07:59 | Really common modification with those cars is to fit what's known as an over the radiator cold air intake. |
| 08:05 | So it does away with the factory airbox and it fits a carbon or fibreglass intake that goes over the top of the radiator, as its name implies and draws air directly from the front grill from in front of the radiator so a perfect solution to get a nice reliable airflow of cold, reliable source of cold airflow into the engine. |
| 08:29 | Now with these over the radiator or OTR intakes, it's still quite common to retain the mass airflow sensor. |
| 08:37 | The mass airflow sensor gets relocated and sits essentially right on the inlet to the throttle body and then we have a much more free flowing intake. |
| 08:46 | Now if we don't go and adjust the scaling of the mass airflow sensor to account for these changes, we can still tune the engine, although as I've mentioned, we're going to end up fudging our power enrichment values in particular in order to get the air/fuel ratio we want. |
| 09:06 | And a lot of tuners will do that and nothing else. |
| 09:09 | Now what you'll end up finding though is particularly, in my experience, at idle, we're going to see really significant trims in the fuelling and from my own experience, we end up seeing the PCM need to trim positive values into our short and long term fuel trims. |
| 09:28 | And I've seen situations where this positive trim has been so significant that it's actually triggered the check engine light for an engine bank 1 and bank 2 lean condition. |
| 09:41 | So it seems that the offset or error in the MAF sensor scaling becomes much more prominent at very low airflows like we'll see at idle. |
| 09:51 | OK so now we know what the mass airflow sensor does and we've got a couple of ways we can figure out whether our mass airflow sensor scaling is correct. |
| 10:04 | We're going to talk about how we can go about fixing any errors. |
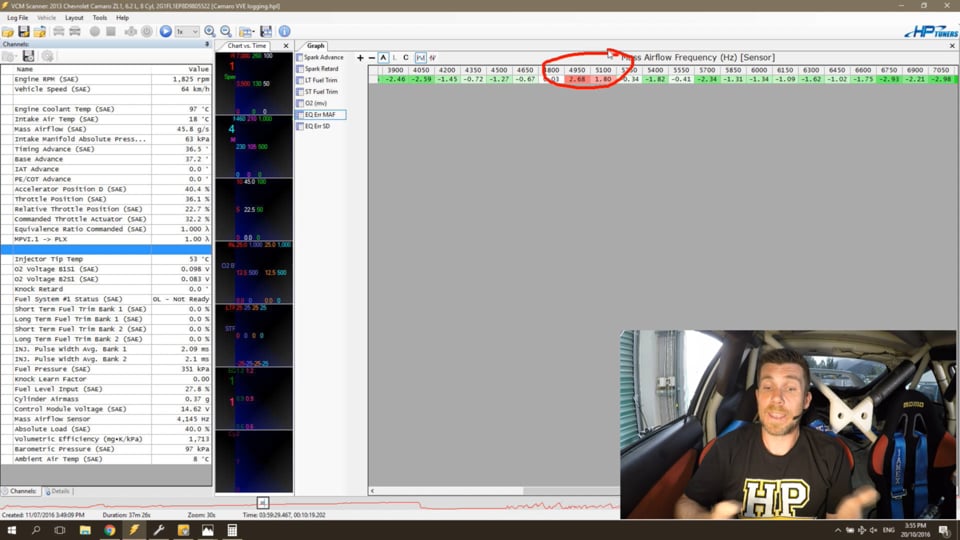
| 10:09 | And what we'll do is just jump into my laptop software right now and I've got a log file that I created when we were doing one of the worked examples for our Practical Reflash Tuning course and this was on a ZL1 Camaro and at this particular point, I've got a lot of logged data, there's quite a large log file and we're going to use this to talk through some of the aspects of the mass airflow sensor rescaling. |
| 10:40 | Now in particular what we can see here is two parameters that are of interest to us. |
| 10:46 | We've got our equivalence ratio commanded SAE. |
| 10:51 | So this is the commanded air/fuel ratio or lambda value, this is what the PCM is requesting or thinks that it is receiving. |
| 11:01 | OK so if you don't work in lambda, you can view this in air/fuel ratio or AFR units as well. |
| 11:07 | Now directly below that we have our wideband lambda sensor, this is fitted in the exhaust and this is giving us our actual measured air/fuel ratio, so this is what the engine is actually seeing or receiving. |
| 11:22 | Now we've got those two parameters logged down here so the purple line we can see is our measured and the green line is our commanded and we can move through this log file and see that for the most part, we're pretty close but we do have some discrepancies. |
| 11:42 | Now when we are rescaling the mass airflow sensor, what we're going to be doing is making use of the histograms in the VCM scanner. |
| 11:52 | This is really one of the most powerful features in my experience or my ideas anyway, most powerful aspects of the VCM scanner software and it really speeds up the process of calibrating and rescaling our mass airflow sensor. |
| 12:10 | So I'll just pull the histograms over and we'll just have a quick look at what we've got here. |
| 12:16 | I've already set this up, we are going to look at how to set this up if you haven't got it done already. |
| 12:22 | And what we can see here is the particular graph that we're looking at, it's a custom one that I've created called EQ error MAF. |
| 12:31 | And you can see that I've also got one directly below which is EQ error SD or speed density so I can use these two histograms for helping me optimise both the mass airflow sensor as well as the speed density sub system. |
| 12:46 | So what we've got here is a, actually what I'll do is we'll just bring this up, we're going to have another look at this shortly. |
| 12:54 | But we'll just have a look at the setup for this particular histogram. |
| 13:00 | And the parameter that we're logging into this histogram is a math channel that the VCM scanner software creates and makes it really easy. |
| 13:09 | And it's called equivalence ratio error and you can see that that's a math channel. |
| 13:14 | So what it's doing, this equivalence ratio error sounds a little bit scary but really it's quite simple. |
| 13:20 | All it's doing is looking at the error or difference between our measured air/fuel ratio or lambda and our commanded air/fuel ratio or lambda and then it's expressing that error as a percent. |
| 13:31 | So as I've said, we'll come back to this. |
| 13:33 | What I want to do now is just look here and see the values that are already filled out in this table and we can see that any time we have a value that isn't 0, this means that we have some error in our mass airflow sensor histogram. |
| 13:49 | What I've done here is I've set up the break points in this mass airflow sensor frequency histogram to match the break points in our mass airflow sensor calibration table in the VCM editor. |
| 14:06 | So what we can do is simply scan and fill out our mass airflow sensor histogram here, our equivalence ratio error MAF histogram. |
| 14:16 | And then we can use the data that we collect there in order to correct our MAF scaling. |
| 14:22 | Before we get to the point of doing any scanning though or creating any log files, there's a little bit of work that we need to do first of all back in the VCM editor software. |
| 14:33 | We need to prepare our PCM to create these log files and what we really want to do here is make sure that the PCM is running first of all in open loop mode. |
| 14:46 | Now if it's not running in open loop mode, what we're going to do is chase our tails here because we're going to end up with the short term and long term fuel trims while we're running in closed loop, so cruise, idle, etc, they're going to be driving the measured air/fuel ratio back to stoichiometric and essentially we're going to fill this table with a whole bunch of zeros. |
| 15:09 | So we're not going to really get any useful data there. |
| 15:13 | And this is a really good point to just mention, there are a couple of common techniques that people use, tuners use in order to rescale the mass airflow sensor calibration. |
| 15:25 | The one we're going to use is the one I recommend where we're actually using a wideband and we're measuring the air/fuel ratio and we're using that equivalence ratio error math channel to help us calibrate the mass airflow sensor. |
| 15:41 | Another common way is to use either the short term fuel trims, or there's another math channel in the VCM scanner software that adds the short term and long term fuel trims together. |
| 15:56 | Now it's common to use this, what we're looking at obviously, if there is an error between the measured air/fuel ratio and our commanded air/fuel ratio, normally that's what the closed loop control system is there for and the PCM is simply going to apply short term and long term fuel trims to correct that error. |
| 16:17 | So using the short term and long term fuel trims to fill out our histograms is effective to a point but what we do need to consider is that this is only, first of all, going to be useful when the PCM is running in closed loop mode. |
| 16:35 | So it's not going to be particularly useful when we're running at wide open throttle and we're operating under power enrichment. |
| 16:41 | And the other aspect is that the short term and long term fuel trims are reactive so it's not a predictive system and we're always going to be lagging slightly behind the actual point. |
| 16:55 | Another common reason not to use short term and long term fuel trims that I've seen a lot of talk about in the forums is that our sensors, our O2 sensors may age. |
| 17:09 | I put that into a little bit of an irrelevancy because even if that is the fact and maybe it's not trimming for actually what is stoichiometric, once we've completed our scaling and we've reenabled closed loop control, our aged sensors are still going to be targeting an inaccurate value anyway so I'll just talk about that because it is something that I see come up in forums quite frequently. |
| 17:36 | OK so what we need to do now is put our PCM into a mode or into a setup that will allow us to actually log this data and we're going to go through that performance now. |
| 17:51 | Now first of all, if we click on our airflow tab and general and then we can see here we have our MAF calibration and that's actually the table that we can see just in the background here, this is the mass airflow sensor calibration so this is the table that we're going to be making our changes to and we can also view this table graphically and what we should end up seeing is a relatively smooth and sort of consistent shape to this curve and you can see it's kind of got an exponential shape to the curve so this is what we're going to be adjusting while we're making our changes. |
| 18:33 | So there's a couple of things that we need to consider here. |
| 18:38 | First of all what we need to do with the system we're going to be using where we're looking at the measured air/fuel ratio, is we need to force the PCM into open loop mode. |
| 18:50 | So we can do that, there's a few tasks we'll need to do there. |
| 18:53 | We'll go to our fuel tab and if we click on our open and closed loop tab, what we're going to need to do is adjust those break points for our long term fuel trims. |
| 19:07 | So what we can see here, I've actually already done some of this work, we have our long term fuel trim, or LTFT enable for a start and you can see that at the moment the minimum ECT value which means that long term fuel trim will be disabled below this, I've set to 256° so we're never obviously going to get there. |
| 19:29 | And likewise the maximum engine coolant temp for long term fuel trims to be operational is basically any time we're above this point, long term fuel trim will be disabled. |
| 19:42 | And I've got that set to the minimum value of -40. |
| 19:45 | So these two adjustments that I've already made to this calibration will disable our long term fuel trims. |
| 19:54 | At the same time we also need to come down and adjust our closed loop enable and this will disable our short term fuel trims as well. |
| 20:02 | And what we can do is click on our ECT vs startup engine coolant temp and basically this table sets the coolant temp that we need to get to before closed loop will become active. |
| 20:15 | So again what we can do is just simply highlight this entire table and set it to 256° Just get rid of this. |
| 20:28 | RIght so I've actually managed to set that to -256 but we'll just set that again, 256° equals. |
| 20:40 | That's not going to work for me for some reason. |
| 20:44 | Ah that's because our maximum value is So right that's better so now what we've got is a table set up there where we'll never go into closed loop control. |
| 20:56 | I also do exactly the same for our O2 readiness engine coolant temperature and again set this to the maximum value which is 152. |
| 21:08 | Now just that little trap that I fell into there while I was trying to demonstrate this, if we look down in the bottom right hand corner, I can't quite show this for that table, I'll just go back to it now I've got it highlighted, we can see that for any particular table, the VCM editor will actually show us the minimum and maximum values that we can put into that particular table. |
| 21:31 | OK so now what we've done is we have eliminated the closed loop fuel control. |
| 21:37 | So our short term and long term fuel trims should continually sit at 0 if they're going to have no effect on our air/fuel ratio. |
| 21:47 | The other thing we need to do as well is go through these tables over here which are our open loop modifiers and these can affect our commanded air/fuel ratio in open loop. |
| 21:59 | And what we want to do is look at any of these tables that aren't set to a value of 1 and we want to set them there so it's as simple as we can left click in the top left corner of the table and set the entire table to 1. |
| 22:15 | And if we cycle through we can see that there's a little bit of work for us to do here. |
| 22:21 | This particular car, it is not a flex fuel system so we don't strictly need to worry about our alcohol tables although when you're doing this sort of work, it's always a good idea to have a structure to what you're doing and simply go through and repeat the same process so you make sure that you're not overlooking anything. |
| 22:43 | We'll just continue down here as well and set our open loop gains as well. |
| 22:51 | Some of these tables, you'll find are already set to a value of 1 and any that aren't, we're just going to set them to 1.00 so they're going to have no effect. |
| 23:03 | Now it's also important that once we have gone through and performed all of our changes that we need to make and we've rescaled our mass airflow sensor, we want to obviously revert these tables back to their stock values so this is just another reason why it's so important to save a base calibration when you first download the ROM out of the PCM. |
| 23:28 | So we can then use that as a compare function and just simply copy the stock values back into all of these tables that we've just adjusted. |
| 23:38 | OK so at this point we have forced the PCM into open loop and we've made sure that all our open loop modifiers are set to 1 so they're not going to have any effect on our commanded air/fuel ratio. |
| 23:53 | Another good point here while we're doing this, just to again make sure that we don't have any modifiers creep in is to disable our CAT over temp protection. |
| 24:04 | So what this is going to do is richen our target or commanded air/fuel ratio if the calculated exhaust gas temperature exceeds the safety limit for our catalytic converter. |
| 24:16 | Typically if we've got an engine that has no catalytic converters fitted to it we'd want to disable this anyway as a matter of course. |
| 24:25 | Now I'm also just going to jump out of order here, I'm going to come back to our cut off and deceleration fuel cut off or DFCO and what we want to do here is set these parameters here to make sure that decel fuel cut, so this is where the PCM shuts off the injectors on overrun, we want this parameter to be disabled so the PCM never goes into deceleration fuel cut off. |
| 24:54 | Now the reason we want to do this is to make sure that we're not going to end up with any rediculous lean air/fuel ratio readings while we're gathering data when we're off the throttle. |
| 25:06 | More relevant if you're gathering your data out on the road on the dyno, we have a little bit better control and we can probably do a better job of this but it's still again a good practice to get into so all we're going to do here is set these vales, so here we have our enable temp, we're setting these values to our maximums to make sure that this feature never becomes enabled. |
| 25:31 | So in this case the enable temp we've set to 256, disable temp, again I'm going to set to, in this case the coolant temp drops below this value, the deceleration fuel cut is enabled, it will disable so we're going to maximise that value as well and we can also set the maximum RPM with our enable and disable so again, all of these parameters just essentially make sure that decel fuel cut off is never going to become enabled. |
| 26:05 | Alright so we've got our PCM pretty well set up here to do some logging, there is one more task that we need to do though and if we jump back to our, oh there's a couple more tasks sorry, we're going to go back to our power enrichment table. |
| 26:22 | Now there's two ways that are commonly used to gather the data or log the data that we're going to want to get to fill out our table, our histogram an then rescale our mass airflow sensor. |
| 26:35 | Now my own personal preference is to still retain power enrichment because I don't really want to be running my engine at high load, wide open throttle with a target air/fuel ratio of 14.7:1 or stoichiometric. |
| 26:51 | I like to run a richer mixture to make sure that my engine's going to be safe. |
| 26:56 | Tuners will however disable power enrichment completely and perform all of this logging with a commanded air/fuel ratio of stoichiometric, 14.7:1. |
| 27:08 | However if you're going to use the power enrichment then we do need to understand some implications of that. |
| 27:17 | And in particular when we're scanning and gathering our data, we're going to see a momentary large error where we step from our closed loop area where we're commanding stoichiometric to our power enrichment. |
| 27:32 | What we're going to see is the commanded air/fuel ratio in the PCM or the scanner will instantly drop down to our new power enrichment air/fuel ratio target. |
| 27:43 | But of course the measured air/fuel ratio isn't going to be able to instantly follow that, it's going to lag and when we get that lag we're going to see a significant error, we're going to have a look at that in the log file shortly so we need to understand the implications of this and I tend to do my scanning or logging of data in two separate ways so that we're not going to be affected by this massive error we're going to see as we move from closed loop to power enrichment. |
| 28:14 | At the same time, it can be worthwhile going through and adjusting our power enrichment values so that we've got 1 fixed target value throughout our entire power enrichment table, this means we're not going to be chasing a moving target so it's just nice to go and highlight this entire table and set it to the same value so in this case we're actually looking at two different calibrations here just to confuse matters, this is for a VF club sport which is a naturally aspirated engine and the scanned data we're going to look at is from our LSA supercharged engine. |
| 28:53 | However we can simply set a fixed value in this table and let's bring up our calculator to see how we can do that. |
| 29:02 | And what I'll need to do first of all is just change back to standard view here. |
| 29:06 | So let's say for example our supercharged engine we want to be super safe while we're setting this up and target a value of 0.75 lambda. |
| 29:16 | If we use the inverse function, that will give us our commanded equivalence ratio value which is 1.333 and that's what we want to enter into this table. |
| 29:28 | Right so that's set our commanded equivalence ratio to one fixed value. |
| 29:34 | The other thing we may want to do here while we're gathering this data is go through to our power enrichment throttle position and set this quite a lot higher than we would normally set it. |
| 29:45 | So that we're not going to accidentally trip into power enrichment while we're gathering our data and we're only really going to get into power enrichment when we actually want it. |
| 29:56 | OK so that's covered our power enrichment, the other thing we need to do is go to our airflow tab, go to our dynamic tab and we need to adjust our high RPM disable and reenable. |
| 30:09 | So for those of you who aren't familiar with the GM PCM, it actually runs a mixed mode system where it's looking at the mass airflow sensor input as well as a virtual volumetric efficiency or speed density subsystem and depending on the mode of operation, it can switch between the two or use a blend. |
| 30:31 | What we want to do is be very sure that while we're gathering our data, the mass airflow sensor is the only input that the PCM is using so what we want to do is set these values very low, somewhere around about 0 RPM so that any time the engine's running effectively, it will be using the mass airflow sensor. |
| 30:53 | The table that we just, the data that was in those parameters there when I came into this tab, those aren't factory values, those were set up to run the PCM purely in speed density mode so this is from a setup I'd done previously so setting those to zero, we're now going to be running on the mass airflow sensor. |
| 31:16 | We can now flash those changes into the PCM, get the engine up and running and start performing some logging. |
| 31:26 | Now before we do that though, what we need to do is make sure that we are scanning the right data, relevant data to make it really easy for us to fill out our histogram and then consequently use that data to correct our mass airflow sensor scaling. |
| 31:42 | So before we close down the VCM editor, let's just jump back to our mass airflow sensor calibration. |
| 31:49 | Now what we want to do is make sure that the break points that are in this table which I've just kind of drawn all over the top of, are the same break points that we are using in our histogram. |
| 32:02 | And what we can do is we can right click and we can go down to column axis and we can click copy labels.. |
| 32:12 | Now what that's going to do is it's going to copy the column axis label, so this is the frequency break points, onto our clipboard and we'll be able to use that data really shortly. |
| 32:22 | So if we haven't already set up our histogram, we need to do this to make sure that our break points are the same.. |
| 32:30 | OK let's jump across to our scanner and we can see we've already got our histogram set up, I said I would go through the set up of this anyway. |
| 32:38 | So we can right click on our graphs and click graphs layout. |
| 32:43 | We can come down to the histogram I've already created and you can see here, I've given this a label EQ error, mass airflow sensor or MAF. |
| 32:52 | Obviously you can call it whatever you want. |
| 32:54 | I'm simply giving it a simple, easy to recognise title, a label so that I can reference that a little bit later on. |
| 33:03 | As I've mentioned, the parameter that we want to scan into this histogram is the math channel that the VCM scanner creates. |
| 33:11 | The equivalence ratio error math and we also want to scan to at least 2 decimal places so we can see some sort of detail, a reasonable amount of detail in this. |
| 33:25 | We do also have the ability to filter. |
| 33:29 | Now this isn't a function that I use particularly and that's because I do the majority of my tuning on the dyno so this allows me to do a much better job on the dyno of controlling the way the engine's operating and gather really good viable data into my histogram. |
| 33:50 | On the road, that can be a little bit trickier. |
| 33:53 | So we can use the filtering to filter our data, so for example to remove large changes in perhaps throttle position or manifold absolute pressure to eliminate the error that can creep in if you've got a large transient operation that can result in the error, equivalence ratio error being inaccurate when we've got that transient active. |
| 34:20 | Now what I've done here as well is I've selected some values for shading. |
| 34:25 | And this isn't necessary but what it does is it gives me a really quick visual cue as to whether I'm rich or lean and also how far rich or lean I have gone. |
| 34:37 | So my general rule here is to set a high value of positive 5 for the red colour, a low value of -5 is a green colour and what this means, if we've got a red colour anywhere in our histogram, this means that we were lean, we've got less fuel in there than we need. |
| 34:55 | So obviously this is potentially dangerous, particularly as we start getting to higher loads. |
| 35:00 | If we're green, this means that we were richer than our target. |
| 35:03 | Now the column axes, in this case, this is the important part here, you can see that we've selected the parameter mass airflow sensor frequency and you'll remember that's what the mass airflow sensor puts out. |
| 35:18 | And here we can see we've got the values for the mass airflow sensor already filled in. |
| 35:25 | Now if we'd come into this and we had set this up from scratch, we'd start with nothing, so you'd have no break points for this histogram. |
| 35:35 | And you can see that when I've removed those values, our histogram simply disappeared. |
| 35:41 | Now remember this is where the copy labels task that we just completed in the editor comes in. |
| 35:49 | We've copied all of those break points for our mass airflow sensor calibration table onto the clipboard and if I press control and V, that's going to paste all of those back. |
| 36:00 | Now what this is going to mean is we know that the break points that we're using are directly the same as our break points in our mass airflow sensor table. |
| 36:12 | So that means when we copy data or make changes based on the scan data, we can copy those directly into the same break point on our mass airflow sensor calibration. |
| 36:24 | OK so we've got our scanner set up, we've got our PCM set up, the next task is to go ahead and start logging some data and actually filling in this histogram. |
| 36:36 | Now there's a few keys to keep in mind here as to what we need to do and how we need to drive the car while we're scanning data and filling in our MAF calibration histogram. |
| 36:49 | First of all we want to make sure that the engine is up to normal operating conditions. |
| 36:55 | We don't want to start scanning while the engine is warming up. |
| 36:59 | Likewise as is quite common with reflashing, you're going to spend a lot of time either stopped on the side of the road with the bonnet down or the hood down, or you're also going to spend a lot of time with the engine shut down on the dyno. |
| 37:13 | And the result of this is quite often straight after a reflash we're going to see that the engine will be suffering from heat soak. |
| 37:21 | So if that's the case, what we want to do is wait and drive the car and get rid of that heat soak, allow it to reach normal operating conditions before we actually start scanning. |
| 37:33 | And the two parameters that I use there to guide me are the intake air temperature and the engine coolant temperature. |
| 37:41 | So we can see both of those parameters over here on our channel list. |
| 37:46 | We've got our engine coolant temperature and intake air temperature. |
| 37:49 | It's always a good idea just to take some notes of what these are sitting at during normal operation and try and start scanning when we're really close to those same values. |
| 37:59 | And again when we're getting any data from a log file, we need to be very mindful, if we're not operating the engine under the right conditions, we're going to end up filling our scanner with garbage data that can end up misleading us. |
| 38:16 | The other aspect is when we are gathering this scanned data, we want to drive the car very smoothly. |
| 38:25 | Now I touched on this already with the transient enrichment. |
| 38:28 | If we make an abrupt change to our throttle positon, this is going to bring in transient enrichment and again we're more likely to see an error in our histogram when we've got transient enrichment so we're trying to drive incredibly smoothly, very very smooth and consistent throttle application. |
| 38:49 | And what we want to do is simply move through as much of this table as we can. |
| 38:55 | So what we'll generally see here is the engine will generally idle somewhere around about 1650 to 1800 Hz in most instances and if we go through the full span of this logged data you can see that we've gone up to about 8100 Hz. |
| 39:13 | From memory that probably isn't quite the full range of operation for this engine. |
| 39:19 | And we see that where we transfer from closed loop operation to power enrichment, or in other words where the PCM moves from targeting stoichiometric air/fuel ratio to our power enrichment air/fuel ratio, that'll generally happen, or happens with this engine, somewhere around about 5000 Hz and that's actually shown by the lean area that we can see here, the red area in our graph. |
| 39:47 | So generally when I'm gathering this data, I'll do it in two ways. |
| 39:51 | I'll gather data in cruise and I'll use that up to about that point where we're transitioning into the power enrichment area of the engine's operation. |
| 40:03 | And what I'm really trying to do here is gather data in the same way the engine's going to operate. |
| 40:09 | So there's not a lot of point gathering, in my opinion, gathering data for our equivalence ratio error table histogram under wide open throttle operation in steady state because simply put, that's not the way we drive the car, that's not the way the engine operates. |
| 40:26 | So around about that 5000 Hz changeover point, below that, I'm going to be gathering data in steady state so I'm cruising and I'm moving through this table by varying both the RPM and the throttle position. |
| 40:42 | So as we move up in the RPM, our mass airflow tends to increase, it follows the shape of our torque curve, it'll increase and then if we continue increasing our RPM, it'll start to drop away again. |
| 40:54 | Likewise for a fixed RPM as we open the throttle further we're going to increase our airflow. |
| 41:00 | So by adjusting both our engine RPM and our throttle position, we can really accurately fill out this table and access as many of the sites as we can. |
| 41:12 | Now what we've got here is this scanned data which shows us the kind of errors that we're seeing and you can see that for the most part, our data's actually not too bad, we've got a maximum value where we were 5% rich and we've got a maximum value where we're almost about 5% lean. |
| 41:33 | So we're within essentially +/- 5% over this area but we can definitely use this data to improve our tuning. |
| 41:43 | You can see that down at idle we are actually a little bit richer again where I've got about -6.5, -7%. |
| 41:51 | Now another key, we're trying to get a lot of data. |
| 41:54 | We're going to see that the air/fuel ratio naturally will always move around a little bit so if we're basing our MAF calibration on a very small sample of data, this isn't going to give us really accurate results so we want to gather a lot of data, spend a lot of time and gather some data and what's going to happen is that these average values that we're looking at right now, will tend to even out so we'll remove any outliers, any peaks and troughs. |
| 42:23 | And a really good idea is to click on the little C icon here, this is the count icon, and this will show us how many samples we've got in each of these cells. |
| 42:35 | So in particular you can see down here we've got a huge amount of data, 12,000, 22,000 samples so that's a huge amount of data and likewise you can see that down at 1500 Hz, this is really a little bit lower than we're going to be idling at, you can see we've just had a couple of flashes in the pan, we've got 145 samples at that particular point. |
| 42:59 | So we really want to get a lot of data, probably in the region of 5000 + samples, we can pretty easily achieve at cruise and that's going to give us some confidence that the values that we're seeing are going to be useful to us. |
| 43:16 | OK so now we've got this data we're going to focus solely at the moment on the closed loop operation, our stoichiometric target area, so values below about 5000 Hz and then we'll look after that at our wide open throttle area. |
| 43:34 | So what do we do with this data now that we've got it? OK there's a couple of ways we can use the data, one of them is to manually make changes based on the trends that we're seeing in this data. |
| 43:48 | And the other way we can make changes is to use the special paste function in the VCM software. |
| 43:56 | So we'll look at both of those. |
| 43:58 | Now if we're using our common sense, what we want to try and do is spot trends in our data. |
| 44:06 | And even when we've got a lot of data, we may still see outliers in our data which aren't particularly realistic. |
| 44:14 | So what we're trying to do, what we ideally should be seeing is a relatively smooth shape to our scanned data, a smooth shape to the error and for the most part, we have kind of got this. |
| 44:27 | You can see here we do have a little bit of a jump between 1800 and 1950 Hz, we go from -4 to a + error of 1.56. |
| 44:36 | So if I'm looking at this sort of data I may want to manipulate these values slightly and make smaller changes so I'm not seeing really significant jumps in my mass airflow sensor scaling. |
| 44:51 | Ultimately we still want to retain a smooth shape to our mass airflow sensor calibration. |
| 44:56 | If we're getting a big bumpy curve to our mass airflow sensor calibration, that's indicative that something is wrong, we've got bad data because that's not what a MAF calibration should look like and it's going to end up resulting in poor drivability so any time we're seeing a really big jump from a positive error to a negative error over just 1 or 2 cells, this is something that I would probably go back and revisit. |
| 45:21 | To keep it simple though, let's look at this error here. |
| 45:25 | So between in this case 2400 and 2700 Hz, we are around about 4% lean. |
| 45:33 | So we can use that data to correct our MAF calibration so 2400 to 2700 Hz, let's just jump back to our scanner. |
| 45:42 | And what we want to do is look at those same values in our MAF calibration, 2400 to 2700 and remember we were on average about 4% too lean. |
| 45:54 | So what we want to do is increase the values in our MAF calibration at these points by 4%, that's going to tell the PCM 4% more errors flowing through at this particular frequency and the PCM will then inject more fuel. |
| 46:08 | So to affect that change, what we want to do is enter a value of 1.04 so we're multiplying these values by 1.04 and this has the effect of increasing our fuelling by 4%. |
| 46:22 | So when I click the multiply sign, that's made that particular change. |
| 46:27 | Now what we're going to do there and I'm not going to do every cell, is we're going to continue through our data and we're going to spot these trends and average the trends and make the relevant changes to our mass airflow sensor calibration. |
| 46:44 | And this, if we're doing this manually as I've said, this gives us the opportunity if we have an outlier, say for example here at 3450 Hz we have a negative 5.16% which is a little bit different to the surrounding values, I might choose to even those out and it's important here to note as well, we're not going to correct our mass airflow sensor calibration in one hit. |
| 47:11 | It's generally going to take perhaps 2 or 3 iterations of changes before we get our mass airflow sensor calibration dialled in really nicely. |
| 47:20 | So don't expect to go and fix everything in one go. |
| 47:25 | It's worth I guess also talking about what sort of errors are we really trying to look for? Now a lot of tuners will beat themselves up trying to achieve the impossible and see an absolute 0 error right through this histogram and to be honest, it's not very realistic. |
| 47:42 | I'm generally happy if I can get my error within +/- 1% and the reality is if you try and chase your tail and get it any better than that, you're probably going to end up simply spending a lot more time, wasting a lot of time for no real benefit. |
| 47:59 | Remember once we've completed this task, we're going to reenable all of the closed loop control and that closed loop control is then going to be able to correct any really small errors, what we're trying to do is make the closed loop control's job as simple as possible. |
| 48:16 | The less the closed loop control system has to do, the better our results are going to be. |
| 48:22 | Now the other way we can use the data from our histogram is to use the special paste function. |
| 48:28 | And this is a quicker way, although it doesn't really give us the opportunity to be as selective with our data. |
| 48:37 | So what I'm going to do now is just highlight all of the data here out to this particular point, in this case 4950 Hz and what I'm going to do is right click and I'm going to click on copy. |
| 48:52 | Now we're going to go back to our scanner and what I'm going to do is highlight our table there and I'm going to right click. |
| 48:58 | And if we come down to paste special, we've got some options on how we're going to paste those error values that we've just seen. |
| 49:06 | And the two that we're interested in here are our multiplied by percent. |
| 49:10 | And as its name entails, all that's going to do is apply our error values as a percentage changes to our MAF calibration. |
| 49:19 | Pretty much exactly what you just watched me do by hand. |
| 49:23 | The other option we can use here is the multiply by percent half and again as its name implies, rather than applying the full percentage error to our calibration, it'll apply half the error. |
| 49:37 | So if we have a 5% error at a certain break point, it'll correct that particular break point in our calibration by 2.5%. |
| 49:46 | The way I tend to use this is when our calibration is a long way out and our errors are quite large, I'll start by using the multiply by percent. |
| 49:56 | Once we start getting into our second or third iteration, just to reduce the chance of any outliers really affecting our calibration, I'd likely use the multiply by percent half but for now, let's click on multiply by percent and what we'll end up seeing is the data in the range that we highlighted, I'm doing a really shoddy job of highlighting that, I apologise, has now been changed by those percentage values. |
| 50:25 | Now a lot of tuners will blindly rely on the paste special function. |
| 50:29 | There's nothing necessarily wrong with it but you do need to understand what it's doing, you do need to understand that it's going to mess up your MAF calibration if you've got any odd data, any real outliers in your data so you need to trade that off, understand that, look at your data, have you got really smooth data, does it seem believable, have you got any crazy values that are just obviously incorrect? If you have, probably much better spending the time and manually smoothing and adjusting your MAF calibration. |
| 51:04 | While we generally aren't going to be operating down here, as a matter of good housekeeping, I'll generally apply any changes that we've seen down in the idle areas to these lower areas of our calibration. |
| 51:18 | So essentially I'm extrapolating our whatever changes I'm seeing in those idle areas across to the left and likewise once we've done our wide open throttle ramp runs, I'm going to do exactly the same to the right past our maximum value. |
| 51:32 | OK so we've looked at how we can use the histogram to correct our mass airflow sensor calibration in the cruise area where the PCM is commanding a stoichiometric air/fuel ratio. |
| 51:46 | Now what we're going to do on the dyno is we're going to gather some data using ramp runs and again, we're just going to fill in our histogram, let's jump back to that now. |
| 51:56 | And now what we're looking at remember is the values above about 5000 Hz and again, these two little outliers here, these negative values come about because of that momentary error, that momentary lean error when the PCM first begins commanding our power enrichment lambda or air/fuel ratio target, while the measured air/fuel ratio comes down and matches that. |
| 52:24 | A really good way I've found of minimising that is when I'm doing wide open throttle ramp runs on the dyno, I'll actually settle the car at wide open throttle, at low RPM on the dyno and I'll wait until my measured air/fuel ratio has stabilised. |
| 52:40 | Then I'll start my scanner. |
| 52:43 | It's also important so that we're not affected by outliers as we back off the throttle at the top of the run, remember we have closed off our decel fuel cut off but still if we back off the throttle at the top of the run, as the airflow drops back down through those areas, we'll get some more error being created. |
| 53:03 | So generally what I'm doing when I'm scanning at wide open throttle is I'll start the scanner when I'm already settled at wide open throttle and at the very top of the run I'll also stop the scanner before I back off the throttle so I'm only capturing data under wide open throttle, the stuff that I'm interested in. |
| 53:20 | OK so the process once we've got that data though is really no different. |
| 53:25 | We can either go through and spot trends and apply those manually or we can use the special paste function. |
| 53:34 | You can see that, particularly in the low frequency areas from the start of that run, my data's reasonably good, I'm within around about 2% most of the way, you can see though in the higher frequency areas, from about 7200 Hz up, the error starts creeping in a little bit. |
| 53:53 | So what we'd see is that our air/fuel ratio was going a little bit richer in the top end. |
| 53:58 | This is why we've set our power enrichment here to one fixed value, again, we're targeting 1 fixed value, makes it really nice and easy to see exactly what our error's doing because we're not chasing a moving target. |
| 54:13 | Again, as I suggested, once we've done those runs, I would copy or extrapolate the sort of error we're seeing out to the right hand side in our MAF calibration. |
| 54:24 | And what we'll do now is, it's an iterative process as I've said, we'll flash that first set of changes through into the PCM and simply repeat our scanning process and if everything's worked out well, what we should find is that straight away, our bigger errors, the large 4, 5, 6, maybe 8, 10% errors, are straight away corrected and we should even see after 1 iteration that our error is within about 1 or 2%. |
| 54:53 | So depending how good our first attempt is, we may need to make another couple but generally 2 or 3 iterations should be enough to correct our mass airflow sensor scaling. |
| 55:05 | OK I'm going to move into some questions and answers shortly so if you do have any questions for me, this is the perfect time to put those into the chat box. |
| 55:14 | It's really important, before we finish with this webinar to remember that we've now made some fundamental changes to the setup in our PCM and once we're happy with our MAF calibration, it's really important to go back and reverse those changes so remember if we click back onto our VCM editor, remember we, we'll go through to our fuel tab, first of all we changed our power enrichment throttle position and we also changed our power enrichment targets so we'd want to set those back to whatever we're happy with. |
| 55:48 | We changed our, disabled cat over temp protection so if you've got a catalytic converter, we want to reenable that. |
| 55:56 | We deleted or eliminated our decel fuel cut off by maximising all of those parameters so again we'd set those back to stock and we've disabled our long term and short term fuel trims and of course we've set all of our open loop tables to 1.0. |
| 56:16 | So again the easy way there, we don't need to go through each of those tables and copy individual values, what we're going to do there is just use the compare function and we're going to load up a compare file and let's just see, no that's not going to work because it's the wrong file, we're going to open up a comparable file that's actually going to work for us and what we're going to see is any tables where we've made changes, you can see that they're highlighted like they are there. |
| 56:50 | What we can do is go into that particular table and the way I do this, there's a couple of ways we can look at the data, these little icons here will show us the data. |
| 56:59 | First of all, on the left we've got our main calibration so this is the calibration we're working on. |
| 57:04 | Next icon over will show the compare file which in this case, this is our base file, so this is the data we want to copy back in. |
| 57:12 | And you can see also the differences between the two tables. |
| 57:17 | So the easy way there is to go to our base file, our original file. |
| 57:21 | We can right click and we can press control, sorry we can click in the top left corner of the table to highlight the entire table and then we can press control C to copy the data and then we can click back to our main and control V will copy that. |
| 57:36 | So you can see that those values are now set back to the original values and if we click on the differences you can see that those are all zero. |
| 57:44 | So the process is just a case of repeating that for each of the adjustments we've made. |
| 57:50 | Alright let's jump in and have a look and see what questions we've got now. |
| 57:59 | Looks like I might have been too quick with the questions. |
| 58:03 | No questions, alright well hopefully that means that I've done a great job of explaining this. |
| 58:09 | Now I can't stress enough that it is actually, once you're used to doing it, it is actually an incredibly quick process to go through. |
| 58:17 | Explaining it takes much longer than actually doing it and there really are only a few steps we need to go through but the process of doing this, if we've done our job correctly, what we're going to find is when we actually get to the point of calibrating the fuel and ignition timing, everything's just going to go so much more smoothly. |
| 58:37 | You'll find that your power enrichment targets will be met straight away, we don't need to fudge any values in the power enrichment table. |
| 58:45 | The PCM is going to have an accurate measure of the mass of air entering the engine so all of its calculations are going to be accurate and correct. |
| 58:56 | So let's just reiterate, the process we're going through here, what we want to do is make sure that we've set the PCM into open loop mode. |
| 59:05 | We want to make sure that we've disabled the dynamic airflow so that we're only concentrating on the mass airflow sensor as an input, we don't want to be affecting our results with the speed density or virtual VE subsystem. |
| 59:18 | And what we want to do is make sure that we are in open loop, we're not going to be getting any closed loop trims coming in, we want to disable our deceleration fuel cut off and we want to zero out or set all of our multiplier tables for open loop to 1.00 so they're not affecting anything. |
| 59:35 | What we're going to do is start our car up, we're going to get it up to normal operating temperatures and then we're going to start scanning some data to fill in our histogram. |
| 59:46 | And again my own personal technique, I treat this in two separate ways, I'm looking at the data in steady state or scanning data in steady state up to about that frequency where we're switching over into power enrichment and then I'm going to gather the power enrichment data through the rev range by performing a ramp run and again just remember, really important to make sure that the data you're getting is useful so we want to make sure that we are only scanning when the engine is under normal operating conditions and isn't suffering from heat soak. |
| 01:00:20 | Now one thing I will add as well before we leave this topic is if you're tuning on a dyno, particularly with an over the radiator intake, you can find that your mass airflow sensor will be affected by the airflow, the turbulent airflow from your dyno fan. |
| 01:00:39 | And what you'll find there is that can really make you chase your tail, you're going to be getting some really odd results in terms of your equivalence ratio error, you're going to be getting some crazy trims from your closed loop system when you've got that enabled and it can be really confusing. |
| 01:00:57 | A really good way to see if your fan is affecting the mass airflow sensor is simply allow the engine to come up to normal operating temperature with your fan in the dyno bay switched off. |
| 01:01:10 | Watch what the closed loop trims are doing under these conditions, so in particular your short term and your long term fuel trims, and take a note of what those are and switch your fan on and immediately watched what's happened to your short term and long term fuel trims and also your measured air/fuel ratio. |
| 01:01:27 | Now if those suddenly go crazy and you're getting really significant trims that you weren't seeing with the fan off, that's a really good indicator that the fan is messing up your mass airflow sensor reading and a trick that I often use there is to build a shield out of something like cardboard that's going to stop the airflow from the fan directly hitting the mass airflow sensor. |
| 01:01:54 | That can end up saving you hours if you don't know what's going on there and of course if you try and correct the MAF scaling when the fan is affecting the MAF sensor reading, you're going to end up with some really horrible results when you actually get the car out on the road, out in the real world. |
| 01:02:15 | Alright guys, hopefully that's given you some insight into the task of rescaling your mass airflow sensor, how easy it is to do and why we want to do it. |
| 01:02:24 | As usual, if you've got any further questions, please ask them, any questions at all for that matter, please ask them in the forum and I'll be happy to answer them there. |
| 01:02:34 | If you want a more thorough understanding of this as well as all of the other topics around reflashing, they are covered in our worked examples in our Practical Reflash Tuning course so that's a great one to check out. |
| 01:02:47 | Alright we'll see you all next week. |