115 | Dyno Operation (advanced) - Mainline AWD1200
Summary
The Mainline DynoLog software is incredibly powerful, however many users only scratch the surface of what it's capable of. In this webinar we will discuss setting up two way CAN communication between the dyno and a Haltech Elite ECU. We will also look at how to display the data you're interested in on the dyno, and how to analyse the results to get your tune dialled in faster and more accurately.
| 00:00 | It's Andre from the High Performance Academy. |
| 00:02 | Welcome to this webinar. |
| 00:04 | We were going to have a look at our Mainline four wheel drive chassis Dyno, and today we're going to look at some of the more advanced functionality of the Mainline Dynolog software. |
| 00:16 | Now, this particular webinar follows on from both our basic and our intermediate webinars on the Mainline Chassis Dyno, so if you haven't watched those, please make sure you check those out in the webinar archive, because a lot of this information will build on what we have already discussed. |
| 00:34 | Now the Mainline Chassis Dyno is an incredibly complex piece of equipment. |
| 00:39 | In particular, the Dynolog software is very, very complex. |
| 00:44 | And I know that probably the majority of Mainline Dyno owners out there around the world will only be scratching at the surface of what that software is capable of doing. |
| 00:57 | Now in a lot of ways, we can speed up our tuning process, and also get better results if we just start utilizing some of the more advanced functions. |
| 01:08 | Some are going to speed up your tuning, others are going to allow you to be much more accurate, much more sophisticated in the way you go about tuning, but it naturally may also take you longer, so. |
| 01:20 | It's all about understanding the capabilities of the Dyno, how these advanced functions work, how they can be added into your regular tuning workflow, and what you can expect to achieve. |
| 01:33 | At least if you understand what the Dyno is truly capable of, then you're going to be able to make an informed decision about what functions to use during your regular tuning work. |
| 01:45 | Now the first function that we're going to have a look at is the two-way communications between the Dyno and an ECU, and we have touched in the previous webinars on the CAN capabilities of the Mainline Dyno, and this is what we're going to be looking at here. |
| 02:01 | So at the moment, the two-way communications, which is where the CAN data stream is sent from the ECU to the Dyno, and also, some of the Dyno parameters are sent from the Dyno back to the ECU, is a little bit limited in terms of what ECUs it's compatible with. |
| 02:22 | And to the best of my knowledge at this point, we've got really good integration here with the Haltech Platinum and Elite series, being that both Haltech and Mainline are Sydney based, in Australia, it makes sense they've obviously worked together to make sure that this integration works really well. |
| 02:42 | I've also used the communications two ways between the Mainline Dyno and a Vi-Pec ECU, or Link G4 ECU. |
| 02:51 | And this actually works with an external USB adapter, so it's actually an external communications line into the tuning laptops, so this doesn't actually use CAN for the reverse communications from the Dyno back into the laptop. |
| 03:09 | And the other one we've trialed and had success with is the two-way communications on the MoTeC platform. |
| 03:16 | Obviously, for Mainline to be able to integrate this, it does require some communications on the part of the ECU manufacturer as well, and some integration on the platform. |
| 03:28 | So, this is why we can't obviously see this kind of integration in every ECU available. |
| 03:35 | So let's have a look, for a start, at how this works, and we've started by getting a CAN communications cable between the Dyno and the ECU. |
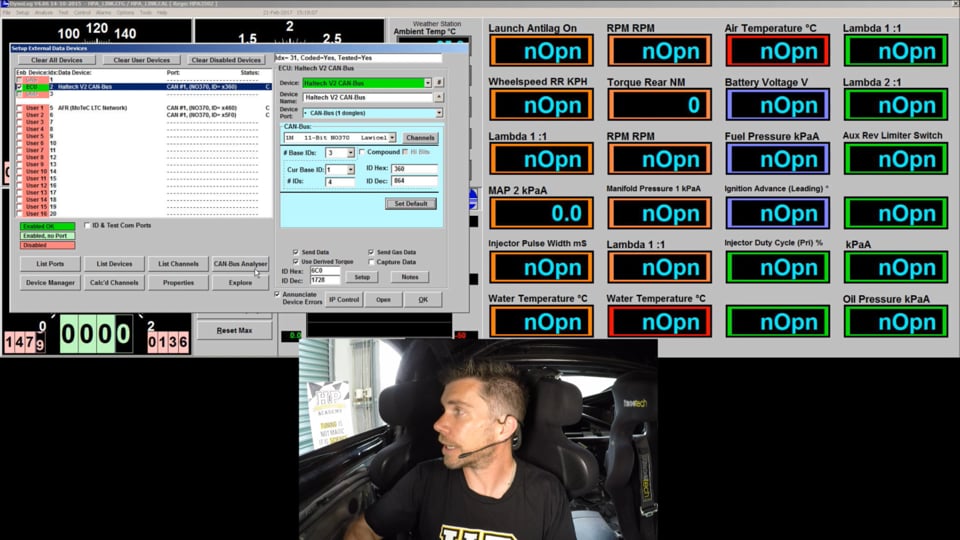
| 03:48 | And if we can just jump across to, I'll just start the car, if we can just jump across to the Dyno software for a moment, on the right-hand screen of our Dyno at the moment, we have a whole range of parameters that are coming in via the CAN communication. |
| 04:04 | So for example, here we have our engine rpm, we have our inlet air temperature, we've got Lambda 1, we've got Lambda 2, battery voltage. |
| 04:13 | Obviously, the list goes on and on, depending on what parameters are actually being sent by the ECU. |
| 04:21 | Now let's just have a quick look at how we can go through and set that up. |
| 04:25 | What we want to do on our left screen on the Dyno software is we want to click on the Setup drop-down menu, and then we want to go down to External Devices, and finally, Setup Data Devices. |
| 04:36 | Now this where we get access to all of the information regarding our CAN communications. |
| 04:42 | So at the top of this particular list here, we have our ECU option, we can see we've got a couple other options at the moment, such as OBD-II, which is grayed out. |
| 04:54 | But we've got our ECU option here enabled, and you can see that at the moment, this data device is listed as a Haltech V2 CAN bus. |
| 05:03 | And we can select that by going across to the right here, and clicking on our drop-down menu, and there's a huge number of supported ECUs here. |
| 05:13 | Obviously for this example, we are using the Haltech version 2 CAN bus. |
| 05:18 | And once we've done this, if we simply click on Set Default, what that's going to do is set the default address for all of that data coming through. |
| 05:30 | It's also going to select the correct CAN bus speed, so this makes it really nice and easy. |
| 05:36 | It's a simple one-click setup. |
| 05:38 | Now if we want to go ahead and use two-way communications, there's a little bit more we need to do down here. |
| 05:46 | You can see that we have this little data box, this little tick box, I should say, that says Send Data. |
| 05:53 | So this is going to need to be ticked. |
| 05:55 | If it isn't, then the Dyno will not send data back on that CAN stream towards the ECU. |
| 06:04 | So I've ticked that already, also, we have the base address that that data's going to be sent on. |
| 06:09 | Again, this is set by default when we click on the Set Default button. |
| 06:14 | Now if we want to view any of the information coming in on the CAN bus, we can also click here, and click on CAN Bus Analyzer. |
| 06:23 | Now this is one of the features that I really like on the Mainline Dyno, it's one that I have used quite extensively. |
| 06:29 | And it essentially is a CAN bus sniffing tool, as well. |
| 06:34 | So what we can see here on the left-hand side is all of the current addresses that are connected to the CAN bus, and we can see all of the information being sent on those various addresses. |
| 06:48 | So in particular, you can see that any information that is changing is highlighted by red, when it stops changing, that box will go from red to pink, and then finally back to white. |
| 06:59 | So you can see, if I give the throttle a rev, a blip, we end up with some changing data. |
| 07:04 | We see a lot more data come through. |
| 07:07 | Now for the purposes of our demonstration today, all we need to know is that the CAN bus analyzer is here. |
| 07:14 | In a future webinar, we will look in a little bit more detail at how to use the CAN bus analysis features on the Mainline Dyno. |
| 07:23 | Particularly for some of you who may want to do some relatively basic, modest CAN bus analysis, this is a cheap way of going about it if you have the Mainline Dyno, because it means you don't need to go and purchase a standalone piece of software and hardware in order to do CAN bus decoding. |
| 07:43 | I will admit, though, it is a relatively basic CAN bus analyzer, so it's not going to do you much good if you want to do some very high level CAN bus decoding. |
| 07:55 | All right, we'll click OK, so we've now set up our communications here in the Dyno, we can click OK, that will take us back out to the main Dyno screen. |
| 08:05 | Now we also need to do a little bit of work inside the laptop, so let's just jump into my laptop software for a moment. |
| 08:11 | And if we click on Setup, and we click on Devices, we need to make sure that our CAN bus setup is correct here. |
| 08:21 | So in this case, we want to select the Haltech Can Bus system, and in this case, I am using the auxiliary CAN bus port for this communication. |
| 08:32 | There's also a CAN bus on the main connector, so we need to make sure that that's set up correctly. |
| 08:38 | Other thing we've got is a Haltech CAN-supported dash. |
| 08:42 | This the data stream that's being sent out to both the Dyno, as well as in our case, the MoTeC C125 dash. |
| 08:50 | And then finally, the other aspect we need to click on here, or set up, is our Mainline Dyno for our dynomometer output. |
| 08:58 | Now in this case, at the moment, it's relatively straightforward. |
| 09:02 | We have the option of Mainline Dyno, or none. |
| 09:05 | So obviously again, at this point, the Mainline Dyno is the only system that the Haltec is designed to integrate with. |
| 09:14 | So we've gone through all of that, and we've got our data stream set up. |
| 09:19 | Now I've set up a separate page, just quickly, to have a look at this, I've called it Dyno info. |
| 09:24 | Obviously once you've got this data coming into the Elite ECU, really, it's up to you as to what you want to do with it. |
| 09:32 | So at the moment, I've got a graph here on the left-hand side that's going to just constantly plot torque and power coming from the Dyno. |
| 09:41 | On the right-hand side, we have got a few channels that I've just got displayed here. |
| 09:45 | We've got our power, our derived torque, and also our road speed, and what I've done is, I've just set up, for this particular example, we're going to have a look at how we can now optimize our ignition advance using nothing more than the laptop screen. |
| 10:02 | So this is just going to help you with your tuning, because you don't constantly need to be straining your neck and swapping between the laptop screen and the Dyno screen. |
| 10:11 | Everything that you need to actually make your tuning changes is right here in front of you on the laptop screen. |
| 10:18 | So what we'll do is, we'll just get our car running in fourth gear, and we'll have a look at some simple turning changes. |
| 10:29 | So I'll just come up to 2000 rpm, and you can see straight away, as soon as we've got the car running, we've got all of our parameters being displayed here. |
| 10:41 | We're doing 52 kilometers an hour, we've got 47 newton meters, and 9.7 kilowatts. |
| 10:47 | So, let's just come up to our -50 kPas are in here, and we'll have a quick look at how we can tune our ignition timing to MBT. |
| 10:58 | So what I'll do is I'll just highlight all of the cells around here for the moment, I'll just set everything to 10 degrees. |
| 11:08 | Okay, so once everything stabilizes, you can see that our torque took a big hit. |
| 11:12 | There, it dropped right down, and we're sitting at 42, 41 newton meters of torque. |
| 11:19 | So if we just use the page up and page down keys, we can add to our ignition timing, and you can see that as I've done that, I've gone from 10 to 14 degrees. |
| 11:31 | We've gone from about 40 newton meters through to about 52. |
| 11:35 | So again, I can do all of this without taking my eyes off the laptop screen, and we've just gone up to 17 degrees. |
| 11:43 | You can see I've gone up from about 50 to about 60 newton meters. |
| 11:46 | So let's go up to 22 degrees, and in this way, what I'm doing is I'm looking both visually at the shape of the graph when I make that particular change, as well as, obviously, I've got the actual numerical value, so that makes it really easy to do. |
| 12:02 | I mean the process here is exactly the same as how we would optimize the ignition timing if we were to be looking at the Dyno screen. |
| 12:10 | As I said, that just means that we don't need to keep constantly moving our head backwards and forwards between the Dyno screen and the laptop screen. |
| 12:21 | Of course, once we've got these channels coming into the Dyno, we can also data log them, so we can utilize these channels as part of our analysis once we have made any particular changes to the ignition timing, or we've performed a ramp run. |
| 12:37 | So with, particularly with our graph here, this wasn't really a great demonstration because we were stationary, but let's just quickly go across and we'll do a ramp run, and we'll see how that all looks. |
| 12:51 | So we're actually going to get a real time dynograph of power and torque being drawn straight onto the laptop screen as I do this run. |
| 13:01 | Just do a little run, just for this example, go up to about 5000 rpm. |
| 13:22 | Okay, so obviously my scaling there wasn't particularly useful for our torque. |
| 13:27 | We ended up off the scale there with our torque. |
| 13:30 | But I'm sure you can understand from there how easy it is to set up, and how useful that can be, having that sort of data coming in to, straight into your laptop screen. |
| 13:44 | Okay, now the next aspect we're going to look at, obviously what we've looked at just here is specific to the Haltech ECU. |
| 13:53 | Remember, this is applicable for both the Platinum Pro series, as well as the Elite series, the Platinum series as well as the Elite series. |
| 14:03 | This will also work the same way with any other ECU, as I've already touched on. |
| 14:07 | It's quite limited at the moment, but any other ECU that will support two-way communication with the Mainline Dyno. |
| 14:15 | Now the next aspect we're going to have a look at is the torque optimization tests that the Mainline Dyno allows. |
| 14:24 | We'll just go back over to our Dyno screen, and we'll just get rid of the run that we've just completed. |
| 14:31 | We don't really need that. |
| 14:32 | Let's go back to our main screen on the Dyno. |
| 14:36 | I'll just allow it to come back down to its control speed. |
| 14:39 | And if we go on this particular screen here, if we go into the Test drop-down menu, and we go down, we'll find Torque Optimization. |
| 14:50 | So if we click on this, this is a really powerful set of tests, and this is actually one of the reasons that we decided that the Mainline Dyno was the dyno we needed to operate High Performance Academy, because it makes it so clear for the purposes of our demonstrations, exactly how aspects such as ignition timing affect our engine torque. |
| 15:15 | And if you've gone through our courses, or you've watched a number of our webinars, there's a pretty good chance you've already seen me demonstrate the torque optimization test. |
| 15:26 | Now let's just have a look at what this is, for a start. |
| 15:29 | What we've got here is, on the vertical axis, we've got torque, so this is measured by the dyno. |
| 15:35 | So this is coming from the torque, essentially at the rear wheels. |
| 15:39 | Then we've got our X-axis, now, at the moment, you can see that I've got this set up to inlet cam angle. |
| 15:46 | Now what we can do is select a number of parameters, or, of a variety of different parameters here. |
| 15:53 | And then what we can do is vary that particular parameter in the ECU, and the Dyno will plot the effect that particular parameter has on the engine's torque. |
| 16:05 | So, and a very clear and obvious one for this would be to do an MBT timing test, where we look at the ignition timing coming in from the ECU via CAN, and we vary that from something such as 10 degrees, all the way through to 50. |
| 16:23 | And what the ECU will, what the Dyno will then do is plot a nice red curve, and it will show how the torque varies as the ignition timing is advanced. |
| 16:35 | And the other nice feature it will do is it will actually show us what particular ignition timing we achieved peak, or MBT, torque at. |
| 16:46 | So in other words, whereabouts in the ignition timing the engine produces peak torque. |
| 16:52 | That's optimal, so that's the number that we should be using in our ignition table for that particular combination of load and RPM, obviously provided that the engine isn't suffering from knock. |
| 17:06 | There's a variety of other parameters that are useful, though, so let's click on Setup here. |
| 17:12 | And first of all, we can see we've got our channel source, and at the moment, the X-axis is set to Inlet Cam Angle #1, and it's coming from our ECU. |
| 17:25 | If we click on the drop-down menu, we can change between a variety of different parameters here. |
| 17:30 | And we're going to try doing a couple of tests here that, hopefully, are going to work. |
| 17:35 | I'll do this cam angle test first, just because we're already set up for it. |
| 17:40 | And then we'll also have a look at changing how the, if your ratio or lambda value affects our engine torque, as well. |
| 17:50 | On some ECUs, we also have the ability to plot our engine torque versus something such as injection angle. |
| 17:59 | It really comes down to what parameters are being transmitted on that CAN template, and we can use any of those parameters, some obviously much less useful than others. |
| 18:11 | Now if we want to change the channels that are coming through, we can click here on our Select Channels box, or tab, and this will show us every single channel coming into the Dyno. |
| 18:24 | We've got a few different parameters here. |
| 18:27 | L says, the L enunciated here says that this is a logged parameter, so this is one that's coming straight into the Dyno. |
| 18:35 | Anything that says C is a calculated channel, and then of course, if we move down, let's just go down here, anything with E beside it, this is an ECU derived channel, so this is coming from the ECU via CAN. |
| 18:51 | And if we've got a particular aspect that we want to look at, we could, for example, if we're tuning a rotary, and we wanted to look at ignition advance on the trailing plug, we could just drag that across to an unused location that'll now be an available channel that we can choose. |
| 19:09 | In this case, we're going to stick to what we've got, but I will just go back and check my setup here. |
| 19:14 | Once we've selected our channel we want to use for our X-axis, we can select the filter. |
| 19:22 | In this case, we're going to use 40 points. |
| 19:25 | And then we can choose our minimum and maximum scale. |
| 19:29 | So in this case, what I'm doing is using zero as my minimum point, in this case, the sort of general range of movement of the cam angle is between zero and about 40 degrees, so I'm going to use zero to 40. |
| 19:45 | And then there's also a delay, with how long the X-axis will take to change. |
| 19:50 | So in this case, I've got that set to one second. |
| 19:53 | So it's just allows enough time for the Dyno to process everything, and actually show us the results of that change. |
| 20:00 | Okay, so once we've got this set up, what I'm going to do is, we'll just get our engine running again in fourth gear. |
| 20:08 | And, what I'm going to do, let's just drop across to my laptop software for the moment, and we'll come back to our main screen. |
| 20:21 | And what we're going to do is just come down, if I can, to our cam target. |
| 20:31 | And what I'm going to do is, we're going to operate our engine up here at about -20 kPa. |
| 20:38 | And you can see that, at the moment, my cam target is 38 degrees. |
| 20:42 | So what I'll do, just for the purposes of setting this up, we'll set this to zero, and actually, what I need to do is set it to one degree. |
| 20:52 | Doesn't quite like being set to zero, gives me some funny readings on the Dyno. |
| 20:58 | Okay, let's just jump across back to our Dyno screen again, and we can see that at the moment, sitting here at part throttle, we're sitting at 262 newton meters, our cam angle's sitting at about two degrees at the moment. |
| 21:10 | And we're sitting at 2000 rpm. |
| 21:13 | So we want to do for this particular test is we want to be very sure, very careful, that we leave our throttle position fixed during this test. |
| 21:21 | I'm just going to click Begin, and now I'm going to begin increasing my cam angle, and what I want to do here is increase this by about a degree every second. |
| 21:32 | And you can see that, as I do this, the cam angle on the Dyno screen is also increasing. |
| 21:39 | And what we're seeing is our cam angle versus our engine torque is being plotted out. |
| 21:45 | And what we're going to do is just smoothly and gradually increase this up until we get through to about 40 degrees. |
| 21:53 | And the Dyno's going to show us, if everything goes as it should, it's going to show us at what sort of cam angle we end up making peak torque. |
| 22:05 | Now when we're doing this sort of test, particularly on something such as our ignition timing, we do have to be very careful, and make sure that, obviously, we are, our load position stays fixed. |
| 22:19 | If we're moving the throttle position, that's obviously going to affect the actual outcome of our test, and basically render it a little bit pointless. |
| 22:28 | The other thing we need to do is, often will involve a little bit of reading between the lines, because we can get a slightly erratic shape to this graph. |
| 22:37 | All right, we've got through to 40 degrees. |
| 22:38 | Now I'm just going to back off the throttle, and we'll see that the Dyno draws another line that comes back down through zero. |
| 22:46 | So what we can see here is that, in this particular instance, the Dyno's telling us that we made peak torque of 298 newton meters, with an ignition, sorry, a cam angle of 25.1 degrees. |
| 23:00 | Now again, just depending on the shape of this curve, we may need to run this test a couple of times. |
| 23:06 | It does take a little bit of practice to get really good, smooth, and consistent results from this particular test. |
| 23:15 | But it's a very, very powerful way of seeing how a certain parameter affects the amount of torque that the engine is producing. |
| 23:25 | All right, I'll just try and do one more of these tests, and this time, we're going to have a look at how the air/fuel ratio affects our engine torque. |
| 23:37 | So what we'll do, just back in our laptop software here for a second, I've just gone back to our base fuel tuning, our fuel base tables, so this is our VE table. |
| 23:48 | And what I'm going to do now is go back across to our Dyno, just to confuse you. |
| 23:54 | We're going to clear that current graph, and we're going to change our setup. |
| 23:58 | And this time, what we're going to do is choose our air/fuel ratio, which in this case is Lambda 1 ECU. |
| 24:06 | And we can choose the minimum and maximum scales that we want to make our adjustments across, so, this case, 0.7 through to 1.1 lambda. |
| 24:15 | This should give us a reasonable idea of how the air/fuel ratio is affecting the engine torque. |
| 24:23 | What we're going to do is, I'll just change our graph scaling for our torque, and we'll go between, in this case, 20 and 120 newton-meters. |
| 24:34 | That should give us enough scale there. |
| 24:36 | I'll just get our engine running, and we may just need to adjust our set point for our engine rpm. |
| 24:43 | Now one slight frustration with this, when we are doing these torque optimization tests, we do need to make sure that we have set our rpm, or our road speed set point, before we start our torque optimization test. |
| 24:59 | I can't influence the set point of the Dyno, the road speed set point of the Dyno, once I've opened up that torque optimization test. |
| 25:08 | So that's just something we need to keep in mind. |
| 25:10 | Here, I'm just going to adjust our torque minimum and maximum again, just so we've got a bit of a useful scaling here, and we can see exactly what's going on. |
| 25:20 | We'll go between, let's go between 100 and 160 newton meters. |
| 25:27 | And we'll now just clear everything there. |
| 25:30 | What I'm going to do now, is I need to do this within the laptop software, so let's just pop across there for the moment. |
| 25:37 | And what I've gone and done is, we've got our Dyno operating, our engine operating, at -50 kPa, and 2000 rpm. |
| 25:46 | Just going to come back down into the center of that cell there, and we're going to make changes to the air/fuel ratio here. |
| 25:54 | Again, just so there's no danger of interpolation, I'm going to select all of the cells surrounding that for the moment, and what I want to do is, I want to just start by leaning our air/fuel ratio out. |
| 26:08 | We can start rich or we can start lean, it doesn't really matter, so in this case, I'm just going to lean our air/fuel ratio out to 1.05 lambda. |
| 26:18 | Okay, so we're about there right now. |
| 26:21 | And just going to, again, just adjust my scaling, just so we're making sure that we're within the scale for our test. |
| 26:33 | Okay, and we can now click Begin. |
| 26:36 | And what I'm going to do is, I'm just going to highlight all of those cells again, and we'll just watch what happens. |
| 26:43 | I'm just going to slowly increase the fueling, and we're going to see what happens as our air/fuel ratio is richened up. |
| 26:57 | Just having a little bit of trouble with my laptop playing up here, it's really hot here at the moment. |
| 27:02 | And my trackpad's just playing up. |
| 27:05 | So we'll just continue to go through. |
| 27:07 | We've gone up to zero point, actually, what I'm going to do is we're going to run this test again, because while I've been talking there, my foot has moved on the throttle, and we've got a Dyno print plot there that's just totally unrealistic. |
| 27:23 | So this is a great demonstration of how important it is to make sure you maintain your throttle position. |
| 27:30 | Right, we're back to 1.05 lambda. |
| 27:34 | So I'll just clear this, and, we'll begin our test again. |
| 27:38 | Right, so this time I'll just make a little bit, be a little bit more cautious that my throttle position doesn't move. |
| 27:45 | And we're just going to, again, richen up our lambda, we're coming through lambda .98 at the moment. |
| 27:52 | Continue richening up, .96, .95. |
| 27:58 | We just want to do this slowly, so it gives us enough time to get a really good plot, and a really good feel for what's happening. |
| 28:06 | Coming down through .93, .92. |
| 28:11 | And we'll go all the way through to about .7, .75, and that should give us an idea of what's happening. |
| 28:18 | We should start to see our torque drop away again. |
| 28:23 | .86 at the moment, and, just coming back down again, .84. |
| 28:32 | .83, and we can start to see that our torque is dropping away a little bit. .80. |
| 28:42 | .79, .78, .77. |
| 28:46 | And I'll stop at .75, I've gone far enough to demonstrate the results there. |
| 28:53 | So really, this particular test isn't so much about showing you the exact results, it's showing you how that torque optimization test works. |
| 29:01 | So again, in this particular instance, at that particular point in our fuel map, we can see that we've ended up with a maximum torque of 114 newton meters, with an air/fuel ratio target of 0.94 lambda. |
| 29:16 | What we can see though, and this is one of the tests I quite often show, we can see that our torque has essentially stayed very flat all the way from about .85 lambda through to about 0.98. |
| 29:29 | We start to see, as we move leaner than .98, we start to see our torque drop away quite sharply. |
| 29:38 | So that's our torque optimization test, and it's, as I've said, it's a very, very powerful tool to utilize. |
| 29:46 | Now, it's important to understand how and when we may choose to use the torque optimization test, because understandably, if we were to use that torque optimization test at every possible combination of load and rpm, it's going to take us a month to tune the engine, and it's simply also not necessary. |
| 30:11 | So I tend to use the torque optimization test as a bit of a sanity check. |
| 30:16 | Sometimes, if I'm really struggling, if I've got a parameter that's having very minimal effect on the engine torque, I may choose to select one particular combination of load and rpm, and use that torque optimization test to really zero in on exactly what's happening. |
| 30:34 | And we'll find that with just about all of the parameters that we're looking at here, if your ratio, cam timing, or our ignition timing, what we're going to find is, particularly for the likes of cam timing and ignition timing, our maps end up having a smooth and understandable shape to them. |
| 30:56 | They don't typically end up looking like Mount Everest. |
| 30:59 | So we don't necessarily have to tune every single, every individual site in those tables. |
| 31:07 | And what we can do is choose a few key locations in the table, and run a torque optimization test on them, and then do some interpolation in between. |
| 31:17 | Again, how you're going to use this will depend on how much time you're prepared to spend, and also, on exactly how fussy you want to be with your results. |
| 31:27 | But again, it's an aspect that if you do have CAN communications between your Dyno and your ECU, it's a very powerful way of harnessing that input, and seeing exactly how it's affecting the engine torque, and hence, power. |
| 31:45 | And I know this is an aspect that a lot of Mainline Dyno operators won’t be utilizing. |
| 31:52 | Now we're going to move into some questions reasonably shortly, so if you do have anything that crops up, anything that I've already discussed, or anything that you'd like me to touch on, please make sure that you ask those questions in the chat. |
| 32:07 | Colin will send those through to me, and we'll answer those once we're finished. |
| 32:10 | We do have a few more aspects to touch on yet, though. |
| 32:15 | Now one of them, which we've already really seen, is one of the biggest advantages with the CAN communication, in my opinion, is the ability to use all of the sensors that are already being input into the ECU, and send these over to the Dyno via CAN. |
| 32:34 | Now particularly, this is helpful, because if you've got a well instrumented ECU, you don't need to go adding additional lambda sensors, for example, onto the engine when you fit your car to the Dyno. |
| 32:51 | So this makes it really quick and easy when you are fitting a car up to the Dyno. |
| 32:56 | All we need to do is connect a CAN bus to the ECU, and then you've got the ability to see all of those parameters that are being input straight into the ECU. |
| 33:07 | Sending them across to the Dyno via CAN, we can read them on the Dyno, and we can use them for our data analysis. |
| 33:15 | So this saves a huge amount of time, compared to crawling in around underneath cars, adding additional lambda sensors, for example, and generally spending more time on your back, underneath the car, then you necessarily need to be. |
| 33:31 | You can instead spend your time getting the car on the Dyno, and get straight into tuning. |
| 33:38 | Now there's two other aspects that we're going to look at today, and one of them is the injector dead time test. |
| 33:46 | Now this is another really interesting test that Mainline have incorporated into the Dyno. |
| 33:52 | We'll jump across to the Dyno software, and have a look at that. |
| 33:56 | We can get to that by going to the Injector Dead Time test option in the Test drop-down menu. |
| 34:04 | Now what this does is, it allows us to perform, well, for the Dyno to perform, I should say, a linear regression test to come up with a pretty good estimate for injector dead time if we don't have any solid data for injector dead time. |
| 34:24 | So there's a couple of things we need to do here. |
| 34:26 | First of all, what we're going to do is jump back across to my laptop software, and what we're going to do is scroll down to our injection system, and we're going to go down to our Dead Time table. |
| 34:38 | Now in this particular case our dead time on our 350Z is dependent on our battery voltage, and also our differential fuel pressure. |
| 34:51 | And this is a returnless fuel system, where our fuel pressure stays constant, so our differential fuel pressure will depend on our current manifold vacuum. |
| 35:03 | So I'm just going to quickly go through this at idle, and what we can see here is we've got an output value. |
| 35:08 | At the moment, what it's basically telling us is that at this particular site, our injector dead time is around about 1.155 milliseconds. |
| 35:17 | Obviously, it's moving around slightly. |
| 35:21 | And what we want to do is come back across now to our Dyno software, and you can see that I've entered this in the little box here that says ECU Dead Time. |
| 35:30 | Now what we're going to do is go through and richen and lean out the air/fuel ratio. |
| 35:38 | You can see that what we've got here is, the X-axis on our injector dead time test is actually equivalence ratio. |
| 35:46 | So equivalence ratio is simply the inverse of lambda, so one divided by lambda. |
| 35:52 | And when we're talking about equivalence ratio, numbers larger than one are rich, and numbers less than one are lean. |
| 36:01 | So what we're going to do now is, I'm just going to jump back across to my laptop software. |
| 36:07 | We're going to come into our fuel base table again, and what I'm going to do is highlight these particular cells here. |
| 36:14 | We can see we've got our air/fuel ratio lambda being measured on the right-hand side of our screen. |
| 36:19 | What I'm going to do is make some changes. |
| 36:22 | I'm going to lean the air/fuel ratio out, and I'm going to richen it up, while we do this, let's jump back across to our Dyno screen. |
| 36:29 | And what we'll see is what happens as we do this. |
| 36:33 | So I'm just going to remove some fuel for the moment. |
| 36:36 | And I've just got our lambda down to 1.05. |
| 36:40 | We can see, this is being displayed on the Dyno screen here. |
| 36:47 | We have our lambda currently sitting at actually 1.07 to 1.08. |
| 36:51 | And what happens is that, ah, let's just actually clear this, and we'll start again. |
| 36:57 | As the Dyno sits there, it performs this linear regression as we lean out, and we richen the air/fuel ratio. |
| 37:05 | And this will give us a pretty good indication of our, our actual dead time, or how much difference there is between our measured value in our Dyno, and our actual calculated, sorry, our value in our, in our software, and our actual value that our Dyno is demonstrating. |
| 37:31 | So let's just continue. |
| 37:33 | What I'm going to do is just richen our air/fuel ratio up again, so we're sitting at 0.95. |
| 37:41 | Now what we need to do is basically give this linear regression a lot of time, and a lot of data points to plot, and make a calculation, or a correction to our, our actual data. |
| 37:54 | It's going to take us a long time at this rate to come back to correct, so what I'll do is, I'll just set that up again, and. |
| 38:04 | This is actually proving to be an incredibly poor test, unfortunately, of my injector dead time test. |
| 38:14 | At this stage, it's not actually working for me at all, which is always perfect. |
| 38:19 | All I can do is tell you that I have gone through this exact test as a dry run, just before we came on for this webinar, and I ended up with results that were almost perfectly aligned with the injector dead time values delivered by injector dynamics, which obviously right now, I'm not getting. |
| 38:42 | Despite the fact that my demonstration in this case hasn't really helped to back up what I've been telling you, this is the process we need to go through. |
| 38:50 | What we need to do is give the Dyno a lot of data points by richening and leaning the air/fuel ratio out, and allow it to perform that linear regression. |
| 39:00 | And that should end up demonstrating what the current injector dead time is. |
| 39:05 | Now I'll point out that this is only going to be relatively close, this is great for those people who are dealing with injectors where there is no supplied dead time value. |
| 39:21 | And this is a question we quite often get in the forums, how do we get injector dead time values if we've got a set of injectors that are unknown, and we don't have any data to start from? So if you've got a Mainline Dyno, performing this linear regression using the injector dead time test is a way of getting yourself some data. |
| 39:41 | Now the test that I just did, again, I'm sorry, it didn't work for me in this particular case. |
| 39:46 | It may well be that I go through and do another example of this at a later point, just to give you a really clear demonstration. |
| 39:55 | But this will only give us the stage, obviously, data at one battery voltage. |
| 40:01 | So whatever the battery voltage is at the point we are performing our test, in this case, we're sitting at 13.7 volts, which is pretty normal for a running car. |
| 40:11 | So there's a couple of ways we can get data at different points. |
| 40:14 | Of course, we have the ability to disconnect the alternator, to stop it charging, that's going to drop our battery voltage down. |
| 40:21 | And we can start adding some load. |
| 40:24 | It's not strictly necessary, in my opinion, to run the injector dead time test for each of these pieces of data. |
| 40:32 | Once we've got a base injector dead time at 13.714 volts, or whatever our normal voltage is, then we can simply go back out of the injector dead time test. |
| 40:44 | What we can then do is make changes to our battery voltage, so again, disconnecting our alternator, and perhaps, applying some electrical load to bring the voltage back down. |
| 40:56 | And then what we need to do is, we'll see, if our injector dead time, at different battery voltages, is incorrect, we'll see our air/fuel ratio fluctuate. |
| 41:06 | So what we want to do is make changes to our injector dead time table, to maintain a consistent air/fuel ratio as we adjust our battery voltage. |
| 41:16 | And that's going to get us a really, as close as we're likely to get, to the actual injector dead time data without going a little bit more in depth and having the injectors tested on an injector flow bench. |
| 41:31 | So again, I apologize that that demonstration didn't work perfectly for me, but the principle of what we're trying to achieve is still sound there. |
| 41:40 | Okay, so the next test, or the next aspect we're going to have a quick look at is analyzing some of the run data in our, in our Dyno. |
| 41:52 | So what we're going to do here, let's jump across to our Dyno, and what we're going to do is go through to the analysis screens, here we're going down there to look at both pages of our data. |
| 42:06 | So if you've got the dual screen option, this allows you to view and analyze a lot more data simultaneously, which is helpful. |
| 42:14 | Of course that's not strictly necessary. |
| 42:18 | You can always analyze all of the data of one page. |
| 42:21 | It just limits how many graphs you can view at the same time. |
| 42:26 | So in this particular case, what we're looking at here is just a couple of test runs, actually done on two different ECUs. |
| 42:34 | So we don't have all of the data here, but in particular, on the top we've got our power in kilowatts. |
| 42:41 | Below this, we have our lambda, or air/fuel ratio, so we can see there's quite a significant difference between our air/fuel ratio between these two runs. |
| 42:50 | Now the next graph down, this is a very useful channel to have a look at, particularly if you're running a high powered car, and you are concerned that you may be getting a wheelspin during a run. |
| 43:06 | So this is a calculated channel, which is called up here into kilometer per hour ratio. |
| 43:12 | So this is simply the ratio between the engine rpm and the road speed. |
| 43:18 | So in this case, engine rpm, for this to work, to give us something useful, needs to come either from the ECU via CAN, that's how we're doing it here for our demonstration, or alternatively, you can use a tacho pickup and directly measure the engine rpm straight from an ignition coil, ignition lead, or an ignition trigger. |
| 43:39 | So the process here, or the idea behind this, is that the ratio, particularly, at least for a manual transmission car, the ratio between the road speed and the engine rpm should be relatively fixed. |
| 43:53 | So that's exactly what we've got showing here. |
| 43:55 | You can see that, if we just get rid of our green run for, our blue run for the moment, we can see that our green line here is a relatively straight line. |
| 44:04 | We start with a ratio of about 42.6 at the beginning of the run, and we did go down to about 40.5. |
| 44:11 | So we do see some fluctuation, and that is normal. |
| 44:15 | And this really continues from what we talked about in our earlier webinars, where as we load the car up, it produces more torque, it's going to climb forward onto that front roller. |
| 44:27 | It's also going to tend to deform the tire a little bit, and this will affect the overall rolling diameter of the tire. |
| 44:36 | We can also, on high powered cars, end up beginning to see some minor amounts of wheel slip. |
| 44:42 | So it's quite typical to see a line like this, where we're seeing a slight change in our ratio throughout the run. |
| 44:50 | What we don't want to see, though, is dramatic blips, and this will often happen around peak torque, or on a turbo charged car, as the engine starts to come onto boost, and we see a large increase in torque over a short range in rpm. |
| 45:06 | This can overcome the traction available, and this results in wheelspin. |
| 45:10 | So that will show up as a significant deviation from a straight line on this particular graph. |
| 45:17 | So that's something to look out for. |
| 45:19 | There are a couple of other aspects there to consider, though. |
| 45:22 | On a manual transmission car, we can also get a similar result if the clutch is slipping, so it's not always a case of wheelspin. |
| 45:33 | We may also end up with the clutch slipping, and for the driver or the operator in the car, the, sort of the symptoms there can be quite similar. |
| 45:44 | It's always reasonably easy to find out if your car's been wheelspinning, though, because you're going to inevitably end up with rubber all up the back of the dyno bay, all over the floor of the dyno bay, that's come off the tires. |
| 45:57 | You're not obviously going to get that if your clutch is slipping. |
| 45:59 | Another aspect is, with an automatic transmission, particularly at low rpm, we will inevitably end up with some slip inside the torque converter. |
| 46:09 | So that's going to mean that right at the start of the run, this ratio will be quite significantly different. |
| 46:16 | But what we'll find is that once we get to the point where the torque converter locks up, and on a factory torque converter, that's going to be relatively low rpm, perhaps 1500 to 2000 rpm, from that point onwards, we should still see a relatively consistent line. |
| 46:32 | The only other thing to consider there is if you are tuning something with a high-stall converter, it's going to move that point where our converter locks up, again much higher in the rev range. |
| 46:44 | The other aspect that I wanted to touch on here is how we can use some of the data that's being shown here on the right-hand screen of our Dyno. |
| 46:52 | So this is great, particularly when we are overlaying, or looking at multiple runs on the Dyno, we've made changes. |
| 47:00 | So here, you can see we're looking at, on the top, our ignition advance, and at the bottom, we've got our inlet cam angle. |
| 47:08 | So let me just bring up one of our earlier runs. |
| 47:10 | Again, our blue run here is off a different ECU, so we weren't looking in this case at inlet cam angle, so we can't compare that. |
| 47:19 | But what we do have is the ignition advance between the two ECUs, and we can also see the effect of that particular change over on our left screen, to our power. |
| 47:33 | So it's very easy, if we are looking at something where we're making one change, let's say, to cam angle, we can look at exactly what that change in cam angle has resulted in in terms of our power. |
| 47:48 | So it makes it very easy for us to fine tune our mapping, and see exactly what particular change we've made has resulted in the power increase, or potentially, decrease. |
| 48:00 | Now last thing to consider here as well is, if we are logging all of our data by CAN, then all of the ECU channels that were available are also being logged, so this means that just because we weren't looking at a particular channel while we were actually tuning the car, we can always come back at a later point, particularly if we notice that there's a trend that's been occurring over some time. |
| 48:27 | Perhaps something may have been slowly deteriorating on the car. |
| 48:33 | We can go back to our data from six months or 12 months ago, and bring up a channel that, at that particular time, we may not have been interested in, and see what that was doing compared to our current data. |
| 48:44 | Example of this might be fuel pressure, or oil pressure, so we can see how those parameters are changing over time, because all of that data is logged and stored on the Dyno. |
| 48:55 | All right, that brings us to the end of our webinar, so if you've got any questions, please ask them now in the chat. |
| 49:04 | And I'll do my best to answer them, and we'll jump across, and I'll have a look at what questions we've got at the moment. |
| 49:16 | Barry G's question, I'll get to after the actual webinar, because it's not really related to this particular webinar. |
| 49:22 | But don't worry, Barry, I'll get to you. |
| 49:24 | Cypher Monks asked, "Without a load bearing dyno "like the Mainline, is the best way "to optimize ignition timing to perform ramp runs, "and observe how the horsepower torque change was, "monitoring for knock?" Cypher Monk says he'll be using a Dynojet. |
| 49:39 | Yeah, if you're using an inertia style dyno like the, some of the Dynojets, then, yeah. |
| 49:44 | That really eliminates any chance you've got of doing a steady state tuning for ignition timing, cam timing, et cetera. |
| 49:53 | And it makes your job a little bit more difficult, because really the only option you have is to tune under wide open throttle ramp conditions. |
| 50:01 | So the process of performing this tuning is simply to start with your ignition timing at a safe, retarded level, perform a run on the dyno, and then you can start advancing the timing. |
| 50:14 | And this is really the same process that is demonstrated in the practical standalone dyno tuning course, where we're simply advancing the timing, performing another run. |
| 50:24 | And what we want to do is continue advancing the timing until we either see no increase in torque or power, or alternatively, we reach the knock threshold for that particular engine. |
| 50:35 | And what we'll find is that, let's say for example, we start with 10 degrees ignition timing across the board. |
| 50:42 | What we'll find is that we will need more timing, traditionally at high rpm than at low rpm, because there's less time available for the combustion event to take place. |
| 50:56 | So what we'll find is if we continue adding two degrees at a time to our entire map, we might find that between two and maybe 2500 rpm, the engine wants 14, or maybe 16 degrees. |
| 51:07 | So we'll find that, as we go past 16 degrees, that timing, that additional timing, no longer results in an increase in torque between 2 and 2500, but we may still see the torque increase at higher rev ranges. |
| 51:21 | So what we need to do is gradually build up our map, and start to produce a shape to that map where we start pulling timing out of areas in the wide open throttle ramp run conditions where we don't end up with any more torque and power, while continuing to add to those areas where we are. |
| 51:41 | All right, looks like that's brought us to the end of our questions for today, so if you do, as usual, if you do have any more questions that you'd like to ask, please do so in the forums, and I'll be happy to answer them there. |
| 51:56 | Thanks to everyone for joining us today, hope this has been helpful for any of you using the Mainline Dyno. |
| 52:02 | Hope it's given you some insight into some of those more advanced functions that will be beneficial to your tuning, help you get a higher quality tune, hopefully in less time. |
| 52:15 | All right, we'll look forward to seeing you all next week. |
| 52:18 | Thanks for joining us. |