277 | Math Channels Advanced (Data Analysis)
Summary
Math channels are a critical part of all logged data analysis at a professional level. In this webinar we’ll go through what math channels are, how they work and how to make use of them in your analysis.
| 00:00 | - Hey guys, it's Tim here from RaceCraft, welcome to this week's gold member's webinar. |
| 00:05 | Today we're going to be talking about some more advanced data analysis techniques, specifically looking at making some more advanced math channels. |
| 00:12 | So if you guys haven't already seen it, I encourage you to go back and look at one of our previous webinars which is looking at an introduction to math channels. |
| 00:21 | Today I'm going to drill in a little bit deeper, use a few more advanced techniques but more specifically than that, we're going to be looking at predominantly damping data or damper position data, look at a couple of different ways we can use that, a couple of different ways we can process it, there's a couple of tricks in there that I think will be interesting and useful to you guys. |
| 00:41 | So for a start, I just want to bring up some damper position data, I'm just going to, if we jump across to my laptop screen here, I'm just going to, I've got a basic screen up here and I'm just going to add in a speed channel to give us some context to start with, so I'm going to zoom out. |
| 01:00 | So this is looking at a, in this particular case a full 3 hour endurance race for a car that I've got some data for. |
| 01:07 | And what I want to start with is by bringing up the damper position data and we just want to have a bit of an introduction to what damper position data looks like and how to interpret it from a really base level so I'm just going to add on the time/distance plot here, the damper position data and I'm just going to look at the raw signal from the front left damper. |
| 01:26 | I'm just going to zoom into the fast lap here and we're just going to, that's not a fast lap, we're going to go and manually select a fast lap. |
| 01:35 | That's what we want to look at. |
| 01:37 | So today we're going to be using our MoTeC i2 software but really again the concepts we're going to talk about today are going to be identical regardless of which data analysis system you're going to be using, it's not going to be at all MoTeC specific today. |
| 01:50 | So here we've got the speed channel along the top and often my personal preference any time I'm looking at a time/distance plot, I've almost always got the speed channel up. |
| 01:59 | It just really gives me a lot of context about what's happening. |
| 02:02 | I can see which position in the lap the car is, what it's doing, whether it's braking, cornering, accelerating, it's just a really nice reference, I almost always have it at the top of the time/distance plot just to help me understand exactly what's happening and where the car is on track. |
| 02:15 | So what I've got plotted here is our corrected speed channel and then I've got our damper position, the raw damper position output channel for the front left damper. |
| 02:24 | Now one of the first things you've got to understand about damper position data is you've got to be careful of the convention. |
| 02:32 | What I mean by the convention is whether a positive value means compression or whether it means extension. |
| 02:39 | So in this particular situation what we've got, in fact if we jump over to the overhead camera for a sec I'll just sketch out exactly how this sensor works for anyone who's not exactly familiar with it. |
| 02:47 | But if we've got our, if we're looking at the front view of our tyre here and let's say we've got the coilover with a spring and we've got our upright here connected to the hub which is connected to the wheel and essentially what we're looking at is how much this whole spring damper arrangement is moving. |
| 03:07 | This is the direct measurement we're taking. |
| 03:09 | So in this particular situation in this car, what we've got is in parallel with the damper, is we've got these little posts that come out and a damper linear potentiometer that's mounted on there at each end and the idea here is that this mechanical measurement is giving us an electrical output that's run across off to our datalogger. |
| 03:29 | So that's what we're looking at here in this data on my screen is how much the damper on the front left corner is moving throughout a lap. |
| 03:38 | So as I said, the first thing that's really important to understand is the convention, what does positive value mean and what does negative value mean? Now this particular car, it is positive values mean that the damper is compressing, it's getting shorter. |
| 03:51 | So it can be configured either way, it depends how it's calibrated, depends how it's set up in the logger but that's the situation we've got in this particular car. |
| 03:58 | Certainly in the raw log data anyway. |
| 04:01 | So there are a couple of different things you can use to understand just intuitively what that calibration is by looking at it. |
| 04:11 | This particular car is a GT car with quite a lot of downforce so one of the things that I always look for if I'm looking at log data for the first time from a car to understand its convention just intuitively is to look at what's happening with the damper position as you head down a long straight when you've got a car with a lot of downforce. |
| 04:32 | So what I can do if I just bring, the shortcut for track map in MoTeC is T so in this particular section of the track I can see that little dot heading down a straight section so I know the car's heading in a straight line, I can see the speed trace is ramping up like this so I know that it's, I know we're looking at a straight section of track and what you can see is as we get faster and faster and faster, the damper positon is increasing so the value's getting bigger. |
| 04:54 | I know because this car's got quite a lot of downforce, the car's going to be decreasing in ride height as we pick up speed so straight away that's an indication that a positive value is meaning the damper is more compressed. |
| 05:07 | There's lots of other ways we can do that, you can look at the sections where you're braking, the sections where you're turning and particularly when it comes to looking at in turning, if I add in the front right channel, so I'm just going to look at both of these channels overlaid to each other. |
| 05:20 | And I think this is something that I've talked about in a previous webinar with looking at using colour conventions. |
| 05:24 | This is something I feel really strongly about, I use the same colour conventions everywhere in all my analysis projects. |
| 05:30 | What I mean by that is each corner of the car has its own colour. |
| 05:33 | So in this particular case we've got front left is red, front right is green, rear left for me is always blue and rear right is always orange. |
| 05:41 | And again, I just find that, because I use the same convention everywhere, it makes it much quicker for me to understand what I'm looking at. |
| 05:47 | So if we look at this section in the track here, we can see there's quite a big difference between the 2 damper positions, its position on track, so that's telling us that one side of the car's up and one side of the car's down. |
| 06:00 | So again if we just pick up our track map here, if I put the cursor in this position, so this particular track has a really really long, over 180° corner so if I move the cursor here you can see where the little dot's moving around the corner there. |
| 06:15 | I wouldn't say it's constant speed but it's approximately constant speed, it's as close as you're going to get to something like a skidpad condition on a racetrack. |
| 06:24 | You've got essentially long, almost constant radius corner. |
| 06:26 | Now what we know, because if we look at the way that the dot is moving as I move along through the lap here, we're turning right so because we're turning right, we know that the front left of the car is going to be sitting lower than the front right because it's going to be rolling over like that. |
| 06:41 | So again this is another confirmation, we can see, because we know we're looking at the front left, we know the front left is going to be compressing, we can see that the value of the front left is greater, we've had a crossover here, it's greater than the front right. |
| 06:53 | We know, and it's another way to tell that the convention is compressing of the damper means positive values for our particular situation. |
| 07:02 | So again, it can be a really, just looking throughout the lap, we can see where the dampers are crossing over in terms of their crossover point, this is where you're going into corner entry, sorry braking, corner entry and you can see as we switch from one direction corner here to a different direction corner here we can see as the car's rolling from side to side. |
| 07:24 | So that just gives you a little bit of an overview of exactly what is happening with the raw damper signal itself anyway. |
| 07:31 | One of the things, one of the other tools I wanted to talk about today was looking at filtering. |
| 07:38 | So damper position data is a really great application for using filtering. |
| 07:42 | All filtering really means is getting rid of some of the inconsistency in the signal. |
| 07:48 | So again if we just jump across to the overhead camera here for a second, I just want to draw exactly what I mean by that. |
| 07:53 | So if we've got a raw signal which is really unsteady, which is something that's typically what we've got in damper position data. |
| 08:02 | Filtering, the idea behind it is we essentially want to smooth out some of that signal. |
| 08:06 | So there's different reasons, you want to use filters in different situations and I'll go through a couple of different examples but essentially filtering is looking at previous and sometimes forward values depending on the type of filter, what I mean by that is if we're logging these different positions along the data like this, it's essentially using the positions around it to kind of smooth out that data. |
| 08:33 | So you can end up with a similar shape but a much less unsteady signal. |
| 08:39 | Now I'm just going to chuck a couple of filters on this damper signal to show you the effect of it and a couple of different ways we can implement it. |
| 08:45 | So in MoTeC's i2 there is a, if we go into the math channel section here, I'm just going to go and make a new channel. |
| 08:54 | So let's say we're going to call it damper position front left smoothed. |
| 09:04 | And I can put an example, just to make it really clear. |
| 09:11 | So if we set this up, for a start we're still going to be using the quantity of length, it's still a length that we're defining. |
| 09:20 | In this particular car all of the damper positions are logged in millimetres so I'm going to change the output units to millimetres here as well so the result of the calculation's going to be in millimetres and I also want to display it in millimetres. |
| 09:31 | The colour I'm happy with because I'm going to make it front left and as I said before, front left's always red for me. |
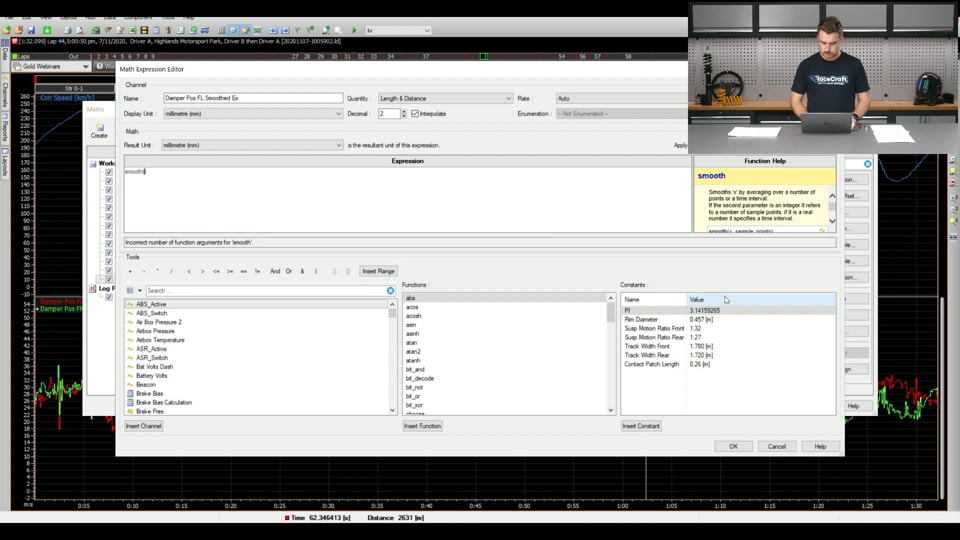
| 09:37 | So we've got a built in function in MoTeC's i2 called smooth so I'm going to use it here. |
| 09:42 | Now there are 2 what we call arguments. |
| 09:45 | When I say argument all I mean is inputs to a function. |
| 09:48 | So if we look in the help section for the smooth function that pops up here, there are 2 different ways we can use it. |
| 09:55 | We can use it by smoothing it over time or smoothing it over distance. |
| 10:00 | I don't know if you guys have got this on full screen, you'll be able to see it, if not it might be a little bit tough. |
| 10:04 | Essentially the 2 arguments we're putting in here is we've got X which is the parameter, so the thing we want to smooth and the second argument is how we want to smooth it. |
| 10:11 | So what I'm going to do is just put my cursor inside the brackets here. |
| 10:16 | Because I want to put the first of the arguments in here. |
| 10:21 | Now if I just go grab my damper position for the front left. |
| 10:25 | So that's our first argument and I'm going to put a comma to separate them. |
| 10:28 | Now this is where we get to choose to smooth by time or distance. |
| 10:31 | In the first instance I'm going to smooth by time. |
| 10:33 | The way that you tell MoTeC i2 to smooth over time is you use a decimal place. |
| 10:39 | So for example, if I wanted to smooth over a 1 second cycle, so essentially a 1 second window that I want to do the smoothing over, I put 1.0. |
| 10:47 | If I want to smooth by 1 metre I would put 1. |
| 10:51 | So that tells MoTeC whether you're going to do time or distance. |
| 10:56 | So to start with, let's put 0.5 seconds. |
| 10:59 | So again I put my argument here as 0.5, the way this reads is it says smooth the damper position signal with a moving window of 0.5 seconds. |
| 11:13 | So it's essentially a moving average filter. |
| 11:16 | So we've got damper position smoothed, let's chuck that in the plot here as an example. |
| 11:22 | So we've got damper position here, the original one and I'm also going to put our smoothed one over top that we just made. |
| 11:29 | So if I zoom in, it's a little bit hard to see at first but essentially you can see the raw signal which is the one that's much more rough and we see we've got a different, in fact let's just for clarity, let me just change the colour on this, even though it doesn't follow the convention, just to make the point on what we're trying to show here, just to make it really clear. |
| 11:56 | So you can see here that that signal is being smoothed, it's kind of getting rid of the unsteadyness in the signal and it's a little bit clearer and we see here even zoomed out you can see how spikey it is, basically there are certain situations where you might want to get rid of the really high frequency noise out of the signal and you might want to look at sort of a more time averaged approach which is what this is showing us. |
| 12:20 | So now if I go back into the definition of that math channel and I just want to smooth over a couple of different time intervals to show you guys the difference. |
| 12:28 | So if I was to smooth over let's say a 2 second time interval which isn't something I'd typically be doing for damper position. |
| 12:36 | Let's just see how that calculates out. |
| 12:38 | So it still looks pretty good, it's still following the, it's certainly following the general shape of the signal. |
| 12:45 | But what it's doing here is it's starting to miss some of the bigger features. |
| 12:49 | So you can see there's a quite big undershoot in the signal here where the damper position's changing quite a lot but because now this window has become so much wider, it's starting to take all of the points in a wider window to do the averaging and as a result, it's missing out on some of that detail so let's go even wider on that window and see how it changes, so let's do say like a 10 second window, certainly something like damper position isn't going to be giving us something very useful. |
| 13:16 | So you can see again while there's some shape to it, it's starting to completely miss the actual behaviour of what's happening with the damper position. |
| 13:25 | So something, the sort of typical signal I'd be using if I were using the damper position to infer something like ride height and I wanted to ignore some of the high frequency noise that's going on in the damper position, certainly that original 0.5 or that 0.5 second window is something I would typically be using myself. |
| 13:43 | I'll put 0.5 in there. |
| 13:48 | You can just see, we'll bring it back to a pretty good representation of what's actually happening with the damper but it's not actually giving us all of that real unsteady noise so using smoothers, every data package will call their moving average filter something else. |
| 14:03 | Usually they have all sorts of different filtering techniques which can get quite math heavy. |
| 14:09 | Oftentimes you don't need to go into those really heavy smoothing or time averaging techniques but every data system will have the option generally to do some smoothing or some time averaging and it can certainly be something really useful. |
| 14:22 | Certainly a useful tool in your tool belt when you're looking through really particularly really high frequency data which is what we're looking at here. |
| 14:31 | So we've gone through looking at different amounts of filters, now I just want to touch on constants because constants are something we're going to be looking at a little bit later in the lesson. |
| 14:40 | So the purpose of a constant, essentially when we're building up math channels, there's different parts to that math channel. |
| 14:47 | We're obviously taking the log data which is an important part of what we're doing. |
| 14:50 | But we also might want to use a value in our calculations that isn't changing ever. |
| 14:55 | So for example one we're going to use today is something like track width So the track width is going to stay constant unless you're changing the configuration of you car. |
| 15:06 | Larger the track width is going to stay constant, things like rim diameter if you're using those in your calculations. |
| 15:11 | The idea here is that it allows you to update that constant value that might well be used in many different math channels, you only have to update it at one place and it proliferates throughout your entire project. |
| 15:21 | So I'll just show you guys exactly what that looks like. |
| 15:24 | So I know that I've got some constants set up I think in the chassis section, let me search here, yep. |
| 15:31 | So if I've got, the way I organise my math channels is I set them, I put them into different categories here which is these different folders. |
| 15:38 | This is just my chassis one that we'll go through a little bit later in the lesson. |
| 15:41 | But essentially rather than looking at the math channel, there's a little tab here to go to my constants where I can define them so I've got some common math channels that I define, that apply to my suspension and chassis parameters. |
| 15:53 | So I've got the value of pi which is used mathematically quite a lot. |
| 15:57 | Again I could type that value 3.141 into all of my different equations throughout my math channels or, not that value of pi's going to change but I can just write pi in it and it becomes maybe a clearer example of what exactly I'm trying to do in that math channel because I'd be able to write pi rather than write the raw value. |
| 16:16 | Same here is I've got things like my motion ratio and the track width. |
| 16:19 | Like I said before, this means that inside the math channel which we'll see an example of soon, any time I want to use the value track width which on this particular car is 1.78 metres. |
| 16:32 | So I could potentially write 1.78 everywhere I wanted to use a track width in my calculation. |
| 16:39 | The beauty of doing it here if I ever changed it, if I need to update it, I only need to come and adjust it in one place and it'll proliferate throughout every single math channel within my analysis project which is certainly, can be pretty important when your math channels start to get long, complicated, when you start to have a big library of math channels, it can become really cumbersome and really easy to make a mistake if you don't go through and update it everywhere so just using constants can be a nice way to help keep your project nice and organised. |
| 17:06 | So now that I've introduced a couple of those concepts, I just want to jump into the main example I'm going to talk about today and that is using damper position data to calculate how much each end of the car is rolling so to give us a roll angle for the car. |
| 17:20 | So there is actually a really simple calculation that we need to go through, I'm just going to get rid of a couple of these channels here to make some room. |
| 17:31 | I'll just get rid of my little presentation pointer there so it stops drawing on my screen. |
| 17:37 | So there's a couple of different steps we need to go through in order to calculate the roll angle. |
| 17:43 | The first thing that we need to do is we basically need to correct our damper position. |
| 17:46 | Now what I mean by that is the way the dampers are zeroed are going to be different for everyone, so sometimes people aren't zeroing them at all and sometimes they'll be zeroing, you'll be zeroing your dampers which essentially just means putting a reference in. |
| 17:59 | Sometimes people will be zeroing them with the car sitting on the flat patch, so you're doing your setup, you've gone around and done your wheel alignment, your corner weighting and everything, you'll usually, well the way some people do it is zero the car on the flat patch, so that means set all the, put an offset into the dampers so all of the dampers read zero when the car's sitting statically at ride height. |
| 18:18 | Some people will do the damper zeroing with the car at full droop so what I mean by that is when all the wheels are hanging completely free so the dampers are fully extended at each end of the car, they'll then go through and zero the dampers at that position. |
| 18:32 | So this particular car which is a car I've done some work with in the past, this particular car was zeroed, the dampers were zeroed when the suspension was in full droop and we should actually be able to see that if I look at some of the pitstops here. |
| 18:46 | So I'm just, to give you an idea of what I'm looking at here this is zooming out across the whole race, looking at the speed trace I can see these dips where we've made pitstops here so I'm just going to zoom into these sections here and what you can see there is this particular car, because it's an endurance racing car it's got air jacks. |
| 19:02 | So during the pitstop the air jacks go on all the wheels, sorry the wheels hang down 'cause the car's up in the air and that's what you see in this dip in the damping data here so both front dampers are dropping to approximately completely zero. |
| 19:16 | You're not always going to get exactly zero when the wheels are hanging even if you've done your calibration, your zeroing when the wheels are hanging. |
| 19:23 | That's because you'll usually have one end of the car being slightly held up by the offset and antiroll bar position. |
| 19:29 | So as long as you're pretty close there, I'm pretty confident that calibration is still correct but that's where you'll be getting the small offset there, the front right's getting slightly held up by the front left just because you have a slightly different adjustment in the antiroll bar link which means they won't completely drop to one side. |
| 19:46 | When we do that calibration, typically you take the antiroll bar links off to allow them to mechanically drop. |
| 19:51 | The reason they actually do that on this particular car is because we spend quite a lot of time tuning the bump stop gaps and the beauty, again there are lots of different ways you can approach it, this is just the process on this particular car just to keep it really simple. |
| 20:06 | The idea there is as long as I know the height of my bump stops and the height of the bump stop packers that I'm using at each end of the car, if I know, because I know the entire stroke available of the damper, if I do the zeroing with each damper hanging completely zero, then that means I can calculate the exact bump stop gap at any point on track really simply. |
| 20:25 | It just makes it, this particular car doesn't run with a team that is particularly sophisticated so there's not a huge amount of I'd say resource to keep different electronic tracking sheets and everything updated so you tend to have to keep things pretty simple. |
| 20:39 | So that's why I just find it a little bit simpler to do all of the damper zeroing with the wheels sitting in full droop when we're doing the setup. |
| 20:49 | Again there's different situations, every situation's a bit different, that's how I tend to find I keep it a little bit simpler with this particular car. |
| 20:57 | So coming back to what I was originally talking about, what we want to do is look at, we want to correct the damper position. |
| 21:04 | Maybe before I get too far into this, I need to talk about exactly how we're doing that roll angle calculation just to give you guys an understanding of the approach we're going to take so if we just flip across to the overhead camera again I'll just do a little bit of a sketch of the approach we're going to take before I dive into the explanation on zeroing dampers. |
| 21:26 | So let's say we're looking at the front view of the car, looking at the front axle for argument's sake. |
| 21:31 | These are our front tyres. |
| 21:34 | And let's say this is our sprung mass so let's pretend this box up here is representing our chassis and these are our tyres. |
| 21:42 | So obviously when we're going down the straights we have almost zero or totally zero roll angle. |
| 21:48 | What we have when we get to the corners is we have the sprung mass rotating relative to the road and the difference we're measuring is how much the sprung mass is rotating with respect to the unsprung mass which is just another way of saying how much this chassis is rotating with respect to the suspension. |
| 22:04 | So let's say we're in a corner and now the new chassis position is here 'cause we've taken a set mid corner and now tha't how much the chassis' rolled. |
| 22:14 | So what we've got now is a situation where we've got a different damper measurement from one side of the car to the other. |
| 22:21 | So dampers, to draw it really simplistically look like this so we've got one side of the car where the spring is mostly fully extended and one side of the car where the spring is really compressed. |
| 22:32 | So the approach we're going to take here is we're going to use the difference in height of each of the dampers side to side to calculate approximate roll. |
| 22:42 | Now it is an approximation but it's a pretty fair approximation and it's certainly very useful in my experience. |
| 22:48 | So what we're going to do, we're going to use a little bit of basic trigonometry, take you back to, if you guys use what we call the SOHCAHTOA rules is how we were taught math in New Zeaaland, basically using the sine, cosine and tangent and it's really really simple, there's nothing to be afraid of here. |
| 23:05 | But essentially we're going to use these differences in the 2 heights to solve the angle of a basic triangle. |
| 23:12 | So what I mean by the differences in height, so if we take this, just project this line across, we're going to take this difference in height, which is, I'm going to call delta H, difference in height. |
| 23:24 | And we're going to use our track width which we've got defined already in our software. |
| 23:30 | So I'm going to say that track width, and let's say for argument's sake this is the front track width. |
| 23:36 | We're going to convert this situation into a basic right angle triangle. |
| 23:40 | So if we simplify this down, essentially what we've got here is a triangle that looks like this. |
| 23:49 | So we've got, this is a right angle here, we've got, sorry we've got delta H represents the vertical part of the triangle and the horizontal part is represented by the front track width and both of these are just numbers. |
| 24:05 | This delta H is what we're measuring, we're going to measure the difference in the damper positions and the track width is just whatever track width you've got in the front of your car.. |
| 24:12 | And what we want to know is theta here, which theta is just a mathematical term for the angle, it doesn't mean anything, it just means the angle that we've got of the chassis. |
| 24:22 | Obviously the roll angle we're talking about calculating here is just the roll angle on the chassis with respect to the suspension, it's not the roll angle included in the tyre deflection which is obviously a real part of the roll angle but the only part of the roll angle you can actually measure with damper potentiometers anyway is by using the roll angle with respect to the suspension which in a lot of cars, certainly road cars, tends to be the most dominant part, well is one of the very dominant parts of the roll angle. |
| 24:50 | So we can use, like I said before we can use some basic trigonometry to solve this for the roll angle. |
| 24:57 | So like I said before we learned it here as SOHCAHTOA here in New Zealand, so TOA means opposite over adjacent and that tells us to use tan. |
| 25:04 | So I'll write that out to make that a little bit clearer, what that means is to solve for this angle, the equation is tan theta equals opposite over adjacent. |
| 25:16 | That's how we learned it here and I'm sure everyone watching learns it really similar at school, it's a very simple equation to solve. |
| 25:22 | Now we want this, we want theta, that's the angle we want at the front of the chassis 'cause we want to know how much it's rollled. |
| 25:29 | So you can use inverse tan, so we can solve this equation by going to theta which is our angle, equals inverse tan of opposite over adjacent. |
| 25:42 | Now if we look back at our triangle that we've simplified this down to, our opposite is the angle opposite, sorry the distance that's opposite the angle and the adjacent is the dimension that's adjacent to the theta here. |
| 25:57 | So we can just simply substitute those values in here, that becomes theta or our roll angle is equal to the inverse tan of delta H over our track width and that's what we're going to be solving for inside of the data analysis project today. |
| 26:14 | So that's the math we're doing, I've taken quite a long time to explain that but as you can see it's actually a really really trivially simple thing to solve and this function tan is going to be built into every analysis project you use anyway, it's not something you have to write from scratch, whether you're using arctan or the original tangent it's going to be built in for you. |
| 26:33 | So that's the approach we're going to take when we solve this equation. |
| 26:36 | What I talked about before is we want to, the next step we need to take when we're doing these calculations is we want to look at the difference in wheel position so that's what I was calling delta H in that example or the difference in height. |
| 26:52 | What we want to know at each end of the car, so I'm just going to talk about the front end of the car today just to keep things simple but we're doing the exact same process on the rear just with the different parameters. |
| 27:02 | We want to look at the difference in the wheel position. |
| 27:04 | So we're measuring damper position here, what we actually want to start with is by measuring, we want to define the wheel position. |
| 27:11 | So let's jump into the math channels here and we'll look at our, we'll go through it step by step looking at how I've got this defined. |
| 27:19 | So what I've got here is my corrected damper position and I'm multiplying it by my motion ratio. |
| 27:25 | We're going to go back and forward a little bit through these math channels but I just want to make sure I talk through the definition of these really clearly. |
| 27:30 | So the motion ratio is the motion ratio between how much the wheel moves with respect to how much the damper moves. |
| 27:34 | So like I said we're measuring the damper position, is the signal we're actually measuring but when it comes to roll angle the position or the difference in positions we're actually interested in is the difference in wheel position not damper position. |
| 27:45 | There are certainly times you're interested in the damper positon, the raw damper position value but when we're looking at roll angle we're looking at the difference in wheel position. |
| 27:53 | So all I'm doing there is multiplying the motion ratio by the damper position and that converts the amount the damper is changing to how much the wheel is changing because obviously different suspensions have different motion ratios depending on how inboard the damper is from the wheel or depending if it's running through a rocker or whatever kinematic suspension you have here. |
| 28:10 | And I've actually got that motion ratio defined as a constant, for this particular car the motion ratio is quite constant so I've just got that value there as 1.32 which is how much the wheel moves with respect to how much the damper moves. |
| 28:22 | So that's, you can also see here just as a little helper, MoTeC actually highlights, or it changes the way the constant values are displayed, it uses a non bold text and it colours it as blue. |
| 28:36 | Again that just tells the user really quickly that that is a constant value that's being used which is coming from our constants table here. |
| 28:44 | I just want to dig into our next, the correction of the damper position. |
| 28:47 | Now what I mean by correction is what we want is when the car is sitting flat, so let's say it's sitting back in the pit lane, let's say it's sitting on a level surface. |
| 28:56 | In order to make this calculation really simple for us, the first thing we want to do is essentially apply an offset to each one of those positions, each one of those damper positions such that when the car is static or as close to static as we're going to get it, we want to offset each of the damper positions so they read roughly zero when the car is sitting there statically. |
| 29:16 | Now there's lots of different approaches you can take to this, like I said before, maybe you can do all of your damper zeroing when the car is sitting there statically when you're doing your setup, that's one way to do it. |
| 29:26 | Another approach, which is what I'm going to show today, one of the approaches you can take is essentially by looking at the time when the car is in the pit lane, so the car is travelling down the pit lane at a constant speed and there's not a lot of acceleration, it's travelling at a relatively constant speed, basically looking at all of the points where that situation is true, where you're travelling at constant speed without a lot of acceleration on the car, taking an average of all of the times that condition is true and using that as an offset to correct our damper position. |
| 29:53 | Now I know that might sound a little bit complication at first but I'm going to walk you guys through how that exact calculation works so I think I've got the calculation for the offsetting in dampers. |
| 30:05 | Yeah so the first thing we are using is I want to know the times in the lap when what I'm calling the steady state pit lane condition is true, that's what I've got written here, my particular, the way I've written it here is SS for steady state, that just means the car's travelling at constant speed and it's not bumping and rolling around too much. |
| 30:24 | So we want to define a time when we can consider the car is actually travelling at steady speed or steady state sorry. |
| 30:30 | So I've got another place I define this on my conditions here which is this condition called is steady state pit lane so this is just the convention I use to naming my condition channels. |
| 30:41 | So I might have one for is braking, is accelerating, is cornering, is steady state pit lane, this is just telling me, giving me a 1 or a 0 if this condition is true. |
| 30:49 | So again I'm using this syntax here in MoTeC called choose and I just want to maybe go through, before I jump into this a little bit how the choose statement works so we'll just jump across to the overhead again, I'll just write out exactly what's going on there. |
| 31:05 | So the choose is used to say basically a test so if this is true do this, if not do this. |
| 31:10 | So the way it's written out in i2, we use the keyword choose and there are 3 arguments to it. |
| 31:19 | So there is argument 1, argument 2 and argument 3. |
| 31:23 | Now argument 1 is the test. |
| 31:27 | So this tells us, is this thing true? So I'll go through the statements we're using here but essentially this is just saying, is this value greater than this or is it less than this or is it equal to this or whatever the test is, this is the test. |
| 31:39 | So if this value, if this statement is evaluated as true, then this is, what this statement is saying is if this is true do this. |
| 31:49 | So if true, that's what 2 is and the 3rd statement is, this is what to do, as you've probably guessed it, if false. |
| 32:01 | So that's not really that clear, let me write that again. |
| 32:08 | So the way this statement is reading is saying, if this is true, do this, if this is not true, do this, that's the way the software's going to read this so jump across back to my laptop screen again and we've got essentially the way this is written, so I'm just going to highlight the test here. |
| 32:25 | So all of the test is written in this section here that I've highlighted. |
| 32:29 | So this is saying, this is a set of conditions that I'm saying if all of these conditions are met, this is when I want to evaluate the statement. |
| 32:36 | So this is saying, in this particular car, in this particular series, the pit lane speed is 40 km/h, so I only want to consider times when the pit lane speed is very close to 40 km/h so the first test is saying is ground speed greater than 38 km/h and the next one after that, is it less then 40 so I'm just really looking at that really narrow window so I don't want any times, I could use something like the pit limit button or something like that to trigger this condition. |
| 33:00 | In this particular case I just want to make it a really dumb condition to say is it between 38 and 40, I don't want any times when the pit limit button might be on, coming in hard into the pit lane, that's going to skew my results, I only want to look at times when you're between a very narrow window of 38 and 40 km/h and the majority of that is going to be happening when the car's already slowed down and travelling at steady state through the pits. |
| 33:23 | Now there are 2 other conditions I'm using here. |
| 33:25 | So I've gone through, must be greater than 38, must be less than 40 but then I've also said the lateral G must be less, the absolute lateral G force must be less than 0.1 and absolute longitudinal G force is less than 0.1. |
| 33:38 | So what I'm saying there is in addition to having to be going in a really narrow speed window for this statement to be evaluated as true, I'm also saying the lateral and the longitudinal G force has to be really low. |
| 33:50 | If the car's sitting there bucking around like this, I don't want to consider that in my calculations for offsetting the damper position. |
| 33:56 | And the last 2 parts there are a 1 or 0. |
| 33:57 | So basically the way that statement's reading, all of those conditions evaluate as true, this channel is going to give me a 1. |
| 34:05 | If any of them or all of them are false, it's going to give me a 0. |
| 34:10 | So let's, what I'm going to do is just show you guys what that channel looks like on the time distance plot just to give you an idea of when that statement is evaluating as true so again I'm just going to zoom out and look at my pitstops here. |
| 34:25 | So we've got this section here, the car's still on track, enters the pit lane and then this section here when we're travelling in constant speed. |
| 34:35 | This is the area we're evaluating between 38 and 40 km/h and you can see where this is steady state pit lane channel is jumping between a 1 and 0, 1, 0, 1, 0, 1, 0, 1, 0, 1, 0. |
| 34:48 | So the times when that's equal to 1 is the times where all of those conditions are true. |
| 34:53 | So what I'm going to use this channel for is it's a trigger for doing my next calculation which is figuring out the rough damper position when the car is travelling at steady state pit lane and we're using it as an approximation for all of the dampers for when they should be set to zero. |
| 35:11 | So let's jump back into the math channel editor again, look at the steady state pit lane calculation. |
| 35:21 | So this next channel is basically saying just with this front left corner, what is the average front left damper position when steady state pit lane is true? So I'm using the state mean function and again if you guys are using MoTeC you can click through here and it gives you a little bit of help about the different ways we can use this. |
| 35:38 | Essentially the way I'm using this channel here is that stat mean, mean's just another word for average, it just says give me the average from the whole log file, give me the average front left, the average of the front left damper position every time this value steady state pit lane, which remember is the one I plotted down here before, every time that's true. |
| 35:57 | So let's plot that, let's see what that calculation looks like. |
| 35:59 | So damper position in steady state, we'll add that on here as a plot. |
| 36:04 | Damper position front left, steady state pit lane and then let's actually also add the raw damper position as well. |
| 36:19 | So here, just zoom out a little bit, I'll show you so we've got our raw damper position which is the same value as we've got plotted up here and then I've got the calculation for the average. |
| 36:28 | So this is the average calculation, it's saying give me the value of that channel every time that this thing here, is steady state pit lane value is true. |
| 36:37 | So what we can see is that when the car is in, I'm just going to zoom in a little bit to the pit lane, so when the car is in the pit lane in this steady state condition when we're travelling constantly in the pit lane, you can see this value is roughly hovering around this, this rough value is hovering around this line. |
| 36:52 | That's telling us that that average calculation is, it looks like it's working pretty well. |
| 36:57 | We've got essentially any time the car is in the pit lane which is going to be at the start and the end of the log file because that's when this particular logging system turns on and turns off. |
| 37:06 | It'll also throughout any pitstops, it's going to be taking the average value any time that steady state pit lane is true. |
| 37:11 | Now the reason I want that, I'm going to use that, what the value is in the pit lane when it's steady, I'm going to use it as an offset to correct my damper position. |
| 37:19 | So let's jump into the math channel editor again. |
| 37:22 | We've got the damper position corrected. |
| 37:25 | So all I'm doing, and because the way you set this channel up depends on the convention that I talked about at the start, we know for us, positive numbers are when the damper's getting shorter. |
| 37:35 | So all I'm doing here is taking the damper position and subtracting this value of the damper position steady state pit lane. |
| 37:43 | Which is the value, that constant value off there. |
| 37:46 | Now that's essentially just putting an offset on it and the easiest way to visualise that is we will plot it on here. |
| 37:54 | Again so if I just add it in. |
| 37:57 | We've put our corrected channel, so this is the final channel that we're going to use before we get into our ride height, so our roll angle calculation. |
| 38:03 | What we can see, it's this value, this lower one that's shown here, we can see that the raw value and the corrected value are essentially tracing the exact same thing. |
| 38:13 | There's just an offset between them and that offset is coming from that averaged position when the car is in the steady state pit lane. |
| 38:21 | And what you can see here is that again if we look in the section where we're travelling at steady state down the pit lane, we can see that essentially the corrected value is if you can see in the bottom left there, if your screen's big enough you can see that essentially it's hovering around that zero mark and that's exactly what we want. |
| 38:36 | If we chuck all of our, let's chuck, just for clarity, chuck all of our corrected damper positions onto a plot. |
| 38:48 | Don't know why my computer's behaving a little bit slowly today. |
| 38:52 | But it will come up, we can see that when we're in the pit lane essentially all of, even though, I mean you can see here later when we leave the pit lane it's jumping around all sorts of different positions as the car's bucking and rolling and moving around the track but in this area where we're in the pit lane, all of those damper positions, because they're corrected have been essentially corrected back to zero. |
| 39:08 | Now the reason that it's important to use the corrected value is that we've now got a base of assuming what each wheel position looks like on each side of the car when we have got no roll on the car. |
| 39:20 | So obviously this is an assumption that's going to depend on the situation, on the track you go to. |
| 39:25 | If there's any slope on the pit lane, stuff like that, how straight the car is running in the pit lane, how much roll's in the car in the pit lane. |
| 39:31 | But essentially this is just giving us a reference point to work from to give us a roll angle calculation. |
| 39:37 | So now that we've gone through the correction we can jump back into our, if we go back to our chassis section here. |
| 39:45 | Bow we can come back to the original channel that I talked about which all we're doing is taking that corrected damper position, which is that last one I showed you and just applying the motion ratio to it, now we've got a corrected wheel position. |
| 39:56 | So now we've got a situation where we can, again if I just, I'm just going to add a second plot in here just to keep it a little bit clearer just add a second time/distance plot and I'm going to put wheel pos. |
| 40:11 | So this is the corrected wheel position for the front left which is the one we've just calculated. |
| 40:15 | So it's going to be really similar to the damper position, it's just corrected for the motion ratio between them. |
| 40:21 | So now that we've got the wheel position, this is what we're going to be using to do our roll calculation where we're going to go back and looking at that delta H that I talked about before when I did the sketch, is look at the difference in wheel position from one side to the other to do our roll angle calculation. |
| 40:34 | So the first thing we want to do is calculate the wheel difference. |
| 40:38 | I tend to break these channels, you can see how many, for a relatively simple calculation like this I tend to break the math channels down into lots of little manageable pieces. |
| 40:46 | It makes it much easier to debug and to understand and also easy to teach as well. |
| 40:50 | So I've got this channel here called wheel position difference front. |
| 40:54 | All it's doing is looking at what the difference is in these corrected wheel position values how different one side is to the other. |
| 41:03 | So if one value's large and one value's small, that's telling us this roll angle in the car. |
| 41:08 | This is just telling us the difference in the wheel position from one side to the other. |
| 41:11 | So I've got wheel position difference front. |
| 41:13 | That's what that stands for. |
| 41:15 | Now if we go into our roll calculation here, this is just an implementation of the equation that I drew out before, this is just saying give me the inverse or give me the arctan of the opposite over the adjacent or the delta H over the track, the track width which is exactly what's written here. |
| 41:35 | So if we've got this value, don't worry about this section at the start to start with, it just says give me the arctangent of wheel position difference over track width. |
| 41:43 | So that's just using that tangent rule to give us, sorry not tangent rule, the tangent calculation to give us the roll angle that we've got in the car. |
| 41:52 | The other stuff I've got shown in here is just a little bit extra. |
| 41:55 | All it's saying is again going back and using that choose statement that I introduced earlier in the lesson, it just means, it just cleans it up, I only want to do this calculation when the car's actually cornering. |
| 42:06 | That's just what this is corner condition is and you can imagine I've got that defined somewhere else in my conditions. |
| 42:12 | It just says basically when there's some amount of lateral acceleration on the car, I'm considering the car cornering. |
| 42:18 | When I plot this, this will become a little more obvious why I've got this plotted. |
| 42:21 | So let's go and look at our, let's plot our chassis roll angle, the output of that. |
| 42:27 | So roll angle front. |
| 42:33 | So now this is just showing me how the roll angle is changing as we evolve through a lap. |
| 42:38 | So let's look at that, let's go back to our fastest lap. |
| 42:44 | Just so we're looking at a normal lap here. |
| 42:46 | So again if I bring up the track map you can see right now we're in the middle of that long 180° corner that I've talked about earlier. |
| 42:53 | You can see we've got relatively constant roll angle on the car and the roll angle is about half a degree so we've got roughly half a degree of roll angle on the front of this car so straight away you can see this is a relatively stiffly sprung car based on only having half a degree of roll angle because it's got so much downforce, that's the reason why. |
| 43:08 | Typically cars with a lot of downforce also have a lot of chassis stiffness and therefore lot of roll stiffness in order to be able to tune the different parameters in the car. |
| 43:16 | But you can see essentially when the times in the lap when we're not cornering, so this section of straight up here, you can see we're heading down the straight in the speed trace, I've just got, that's why I'm using that choose statement, I'm essentially just saying don't show me what the roll angle is unless I'm cornering. |
| 43:29 | It just helps tidy up the plot, it gets rid of clutter. |
| 43:31 | Personally I find it a lot easier to read, it's just a lot cleaner to look at. |
| 43:35 | That's why I've used that choose statement in there. |
| 43:37 | You don't need to use that, I just find it, it's my preference just to get rid of any noise in the data. |
| 43:44 | So now that we've got that roll angle, there are lots of different things we can do with that. |
| 43:49 | We can plot for example the roll angle of the front and the rear axle over top of each other. |
| 43:54 | Again there's a whole lot of stuff you can do with this. |
| 43:57 | You can look at your relative front to rear roll stiffness distribution, you can look at the roll phasing as far as how quickly one end of the car is rolling with respect to the other. |
| 44:06 | This is where you might use this information to make a damping change to get one end of the car rolling faster or slower than the other depending on what sort of transient or time sensitive imbalance you've got going on in your car. |
| 44:17 | But the next thing I'm going to talk about is actually using some of this roll stiffness information, how you can actually tune some of your chassis stuff. |
| 44:27 | But this is a good time to mention if you guys have got any questions that have come up throughout the webinar so far, chuck them in the chat if you haven't already, the guys will transfer those through to me and after I've gone through this last piece of the lesson I'll come back and I will deal to those questions and we'll get through them soon. |
| 44:46 | So the last thing I wanted to talk about today was the concept of a roll gradient. |
| 44:51 | So we've gone through this long winded process step by step to show you guys how to calculate the roll angle if you've got damper position data, the roll gradient, it's essentially, it's a calculation of how much roll you get for a given amount of lateral G force. |
| 45:04 | So the calculation is simply roll angle divided by lateral G. |
| 45:07 | So you can imagine that what we call roll gradient has a relationship to how much roll stiffness we have in the car so the higher the roll gradient the bigger the number the softer the suspension is because that means for a given amount of lateral G force, we've got a lot of roll or more roll than if we had a lower roll gradient. |
| 45:25 | So one of the ways you can plot that, you can calculate the roll gradient directly by simply dividing the roll angle by lateral G. |
| 45:32 | That can be a useful way to do it, one of the ways you'll often see it expressed is instead of actually calculating the roll gradient directly in the calculation is looking at it in terms of an XY plot. |
| 45:44 | So I just want to do one of them now. |
| 45:46 | So I'm just going to chuck this up as an XY plot on this side. |
| 45:48 | So if we come down and make a scatter plot and on my Y axis which is my vertical axis I'm going to put roll angle, I've already got it there, roll angle front and on the lateral I'm going to put G force lat. |
| 46:09 | So I plot that for a start, make that a little bit more sensible. |
| 46:13 | So essentially this is just giving us, you can see this trend here, I've got this section in the middle where it's cut out because I've only got this calculation for roll. |
| 46:23 | The roll calculation is only valid when the car's actually cornering so you can see the lateral G threshold here which we've obviously got lateral G force plotted along the bottom. |
| 46:33 | There's a couple of preferences, I prefer to set this up just to make it a little bit clearer, if I just put the draw style as points I just find it a little bit cleaner to look at. |
| 46:43 | That's just for the front, I'm just going to do the same thing for the rear. |
| 46:48 | I'll come back in here, I'm going to add the rear roll angle. |
| 46:55 | And that's going to put them in top and bottom. |
| 46:57 | Sorry not top and bottom, that's not top and bottom, I want to make it top and bottom. |
| 47:07 | Where am I going to show that? Straight away I cannot see exactly where to do that but essentially what this is showing us is this is the front and this is the rear roll stiffness. |
| 47:21 | Now one of the things you can do that's really helpful is to add a trend line so most softwares have the ability to add, in this case I'm going to add a linear trend line which is essentially just doing our line of best fit through all of the points. |
| 47:34 | So I'm going to select here the option of trend line, a linear trend line also showing the points on there as well. |
| 47:43 | So that's what this little line here is showing us. |
| 47:47 | Now the important thing about that line is the gradient of that line or the slope of it is another way to visualise what I was talking about in terms of roll gradient. |
| 47:55 | So because we're plotting here roll angle versus lateral G, it's essentially rise over run or the gradient, something like what you guys would have learned at school. |
| 48:05 | The stiffness or the gradient of that line is telling us something about the roll stiffness at each end of the car. |
| 48:11 | Now one of the things we're often interested in in terms of chassis tuning is the roll stiffness distribution. |
| 48:16 | That means the amount of roll stiffness you've got at the front of the car relative to the stiffness you've got at the rear of the car. |
| 48:22 | That's really important in terms of both channelling the transient and the steady state load transfer distribution, the reason it's so important is because you've got tyres that are very sensitive to vertical load, that vertical load sensitivity is the main metric that determines your steady state handling. |
| 48:39 | Sorry particularly your steady state balance. |
| 48:43 | So whether you've got understeer or oversteer at each end of the car. |
| 48:46 | The vertical load and the weight distribution is the most dominant parameter when it comes to controlling what sort of balance you've got at each end of the car. |
| 48:55 | That was a really long winded way of saying the relative gradient of these lines is telling you something about the relative stiffness at each end of the car. |
| 49:04 | This particular car is a mid engine'd GT car, it's rear wheel drive so it makes sense that we've got, it's pretty visually obvious to see here that the rear roll stiffness, because the slope is lower, you've got a lower stiffness, lower total roll stiffness in the rear relative to the front and that's because the rear, as well as the rear spring antiroll bar combination controlling how much the chassis' rolling, because it's rear wheel drive we're also trying to maximise the traction at that end of the car, particularly at low speed corners. |
| 49:37 | That's why you'll typically end up with roll stiffness distribution that's biased towards the front in a rear wheel drive car. |
| 49:44 | So one of the things you can do is when you go out and make changes to your stiffness, whether it's your springs or antiroll bar, bump stops, whatever it is, whatever stiffness elements you're using to tune different elements in your car, using the roll gradient calculation is a good validation to see how much stiffness change you've made from one run to another, for example if I've got here, this is obviously a single dataset but just as an example if I was to plot a different run later, these lines almost lying on top of each other but if I had a different spring combination, say earlier in the weekend for from a different setup that I'd run at some point throughout the weekend, you would see a difference in those gradients and that would just be a validation for how much you've changed the roll stiffness. |
| 50:26 | You can automatically show the value of that gradient, the software will calculate it for you, it can be something useful to track in your setup sheet, stuff like that, your relative front to rear roll stiffness but hopefully that has given you a little bit of an insight into how to make some use and also how to process some of your damper data. |
| 50:46 | So now I'm just going to jump across and see if we've got any questions that have come through from today's webinar and it looks like, oh we have got a couple of questions, I scrolled right past them. |
| 50:59 | OK Darren1020, where can you get good damper pots from? Yeah absolutely Darren so that's definitely the first port of call is actually figuring out where to buy these things from. |
| 51:11 | There are heaps of different damper position sensor suppliers. |
| 51:14 | The first thing you need to decide is whether you're going to use a linear or a rotary potentiometer. |
| 51:20 | If we jump across to the overhead I'll just make it really clear what I'm talking about. |
| 51:22 | You may well already know what I'm talking about there but I just want to make it clear for everyone. |
| 51:28 | So again if we've got our wheel there and we've got our damper here. |
| 51:32 | There's a couple of different ways we can arrange that. |
| 51:36 | So everything I've been talking about today has been with linear potentiometers. |
| 51:40 | The output data's very similar but the implementation's a little bit different. |
| 51:45 | So that's looking at, you've got this linear sensor where you've got an inner and an outer shaft and it's just measuring the difference in displacement of that sensor. |
| 51:53 | You can also have rotary sensors so there might be a little rotary sensor here, little arm with a little drop link that drops down onto a suspension arm or an upright or whatever you've got that's convenient to connect to. |
| 52:05 | So the idea here, whereas this one is moving up and down as the suspension moves, it means this sensor is moving around and around and the car, just all it means is the different packaging constraints, the calibration's obviously a little bit different if you're using a linear sensor, it's often a little bit simpler to do the calibration. |
| 52:22 | It's usually a relatively linear relationship, it's often, not always a linear relationship. |
| 52:26 | But if you're using a rotary sensor you need to be able to map your wheel position to the voltage output of that sensor. |
| 52:31 | It's not a big deal, it just means you'll end up with a non linear calibration on that sensor. |
| 52:35 | As far as the rotary sensor goes, there are lots of different suppliers. |
| 52:44 | I can't remember off the top of my head, I did actually buy some to do some testing for our RaceCraft GT86 and if you send me a message in the forums, if you get in touch, in fact I think there might already be a forum post on it that you're welcome to get in touch with me on the forums, I can send the part number through for that for you. |
| 53:01 | The reason that particular rotary sensor's good is because not only is it quite a high quality unit, they're actually really cheap, they're actually only about $30 or $40 USD, it's by far probably the most economical potentiometer you can use for your dampers. |
| 53:18 | At the other end of the spectrum, there's lots of trusted brands whether you go directly to MoTeC, you can buy them, most data acquisition places will sell them to you, anyone that's selling data acquisition gear will have them, you can buy direct from motion and control specialists. |
| 53:32 | Recently I bought some Penny and Giles branded ones which is again like a really common brand you'll come across in motorsport, they're really really high end high quality linear potentiometers. |
| 53:45 | So companies that deal with robotics and control systems are typically the ones stocking those. |
| 53:51 | Often all of those data acquisition suppliers will also supply them as well but if you're interested in those rotary potentiometers, definitely jump into the forums and ask me a question there, I'll be happy to give the part numbers, they're really cheap and easy to buy, particularly out of the United States. |
| 54:06 | OK a question from Hally0, Hally0 asks, how does a damper pot work with bump stops, do they read differently if your car rides a lot on the bump stops? Yeah so that's actually something, I think I touched on it a little bit earlier in the lesson. |
| 54:18 | It's something that you use damper pots a lot for is to understand when the bump stops are actually engaged. |
| 54:25 | So bump stops, there's lots of different reasons you'd be running bump stops, sorry lots of different ways you would use bump stops. |
| 54:33 | In a car that's predominantly mechanical you're probably using it more as a travel limiter but as a car that's much more aerodynamically influenced like the car I was looking at in the data set today, that's a situation where you would be using the bump stops to control the ride height on the straights to allow you to run much softer suspension springs, you control the static ride height, not the static ride height, the ride height when you're on the straight and you've got a lot of downforce, you tend to control those with bump stops and packers. |
| 54:57 | So absolutely, I make a lot of use of damper pots when I'm tuning bump stops. |
| 55:01 | The idea is if you define that relationship between how much suspension stroke you've got and you zero your damper pots in some known position, you can do the calculation to how far away the damper is from being engaged on the bump stop and that's what I use quite a lot to understand particularly if you've got something like a handling problem. |
| 55:19 | Let's say you've got a snap oversteer and maybe in a relatively bumpy corner one of the things I'd often be going to to check would be to see whether I've got a bump stop engaging on some of those bumps. |
| 55:30 | So you can go to your bump stop engagement graph and you can see, is it touching the bump stop in this position on track or not, based on that calculation of how far away you are from the bump stop and it can be a really quick way to understand if you are actually touching that bump stop and it's going to be making, 'cause obviously if you're touching the bump stop, it's going to be giving you a massive stiffness change really quickly as it comes into contact. |
| 55:50 | So all essentially you're doing is mapping the position of the damper based on your damper pots and doing a small calculation on how far away you are from your bump stop because you can measure your bump stop gap obviously before you leave the pit lane. |
| 56:05 | So absolutely you can use them for that and I use them a lot. |
| 56:07 | Suhas Govinderaj, sorry Suhas hopefully I got your last name right there, how accurate is power and torque calculated by accelerometer which is built in? He's pasted in an equation here which isn't going to work very well for me to read out to explain to you guys what he's written but essentially he's just using the calculation of acceleration of the car to infer something about, the longitudinal acceleration to infer something about how much engine torque or how much power you've got to be accelerating the car along. |
| 56:45 | I wouldn't say it's, it depends what you mean by accurate. |
| 56:50 | It depends what you're using it for. |
| 56:53 | So it's absolutely something I've used before in the past when you're comparing one car to another so let's say you've got a team of cars of nominally identical cars. |
| 57:00 | Comparing the longitudinal acceleration and the power you're getting in each gear, and overlaying them over top of each other is absolutely a useful tool for understanding whether maybe you've got an engine problem in one car or maybe you've got a whole lot of drag in some gears and not others or maybe you've got, whatever the situation is, you'll often learn something about looking at the power calculation by calculating it from the longitudinal acceleration. |
| 57:27 | I wouldn't say it's massively accurate, there's a reason, so I should take a step back. |
| 57:34 | If you actually want to calculate engine torque or engine power directly you need to be using a torque sensor which is typically a really expensive element to put in a car. |
| 57:45 | It's essentially a wireless strain gauge which you attach to either the tail shaft or the axles or whatever drive components you want. |
| 57:51 | It's calibrated to sense how much twist or how much torque is applied to each one of those axles and then because they're turning it has to wirelessly transmit that back to a receiver, receiver's wired to the datalogger, because it's wireless just by nature it tends to be bonded, it's quite an expensive thing, it's something that you don't see a hell of a lot of unless you're working in high level motorsport but if you want to calculate the torque and therefore the power accurately that's absolutely a must to use a torque gauge. |
| 58:21 | In most cases, most people aren't going to have access to that so you're limited to using the longitudinal acceleration. |
| 58:26 | You can also use the longitudinal acceleration, the power calculation to learn something about the drag forces. |
| 58:32 | So if you've got 2 cars running nominally the same mechanical configuration, but a different aero configuration you can often learn something based on the longitudinal acceleration of that power calculation as well. |
| 58:41 | So that's all of the questions I've got today guys. |
| 58:44 | I really hope that you guys learned something going through some of those different math channel examples. |
| 58:51 | If there's anything that's come up based on this, feel free to jump in the forums and let's dig into it a little bit further, be great to have some more conversation around data analysis and math channels and hopefully I'll see you guys there, thanks very much guys. |