Sale ends todayGet 30% off any course (excluding packages)
Ends in --- --- ---
I am trying to setup road simulation on a dynapack hub dyno.
To setup the simulation, we need to enter the A, B and C coefficients which could be obtained from a coast down test to be entered into the simulation model to factor in aerodynamic drag and rolling/mechanical resistance.
Doing a coast down test itself is the easy part. But doing the math to work out the coefficients from the test results seem to be beyond my math skills.
Are there any typical value that I could use for standard car types or some sort of software/calculator that could help me do the calculation using the cost down data. Thank you!
Have you asked Richard (support guy) at Dynapack for suggested starting values?
This may be talking out of my bottom, so should at best be considered thinking or discussion points. I think it makes sense but it's way, WAY past my bedtime.
I don't know which you're referring to, but most vehicles that are commonly tuned should have aero' drag, cross sectional area, etc, available on-line. Rolling resistance is more difficult as there are many variable, such as tyre pressure, type, width, brake drag, etc. You could assess that from slowdown, though, or even get a base number towing the vehicle on a flat road with a spring/tension balance at, say 1, 2, 5 m/s. With those low speed values you should be able to assess a rolling resistance curve over a wider speed range. If you have some accurate coasting data for how the vehicle slows down, you may be able to subtract the rolling resistances to leave an aero' resistance curve you can work with.
I'm fairly sure I've done this as actual practical tests, or experiments, but it'd have been a LONG time ago and I'm getting old.
[edit] What vehicle is it for, and how's it been modified?
I think with the use a coast down test, it can approximate the Steady-state rolling resistance (coefficient a), Viscous driveline and rolling resistance coefficient (coefficient b) and Aerodynamic drag coefficient (coefficient c), by changing values in a formula until it matches the deceleration curve but that seems to be beyond my math capability. I guess the aerodynamic data as could be obtained online as Gord have mentioned but not a and b.
Right now I am tuning a JDM V10 STi (GRB), but really we would like to be able to run accurate road simulation on any cars we test/tune. We have only just purchased the dynapack dyno (used). It had an older version of the software which did not include road simulation but a software upgrade can be purchased and we are just assessing whether the upgrade is worth it and whether we have the data available to use it properly.
David; yes, I will ask Richard.
The math' may be beyond me, too, it's been a long time, but can you post the date sets, or format, required for the co-efficients as used?
Might be able to 'reverse math'' something you can use?
The first half of the video explains it pretty well although it ignored driveline resistance in the beginning. I don't think I will consider the factors mentioned in the second half of the video as it will get WAY too complicated and all I can do is try my best to avoid those variables.
https://www.youtube.com/watch?v=Gip3iG2A2zE
And in combination of looking at the screen for road simulation in the Dynapack software:
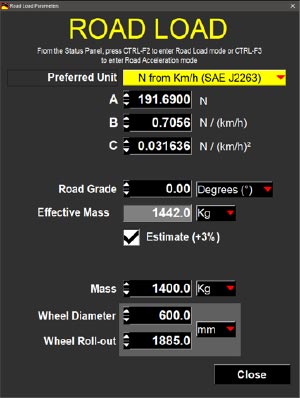
You can see it is looking for A: A constant resistance (tyre rolling resistance?), B: A linear resistance (drivetrain?) , and C: An exponential resistance (aerodynamic drag). So I basically have to plug in different variables into the formula until it produces a curve (which I have no idea how to plot in excel as I barely understand the formula itself) that somewhat matches the vehicles' deceleration curve.
Just spent more time studying the formulas. Seems like it is actually more simple than I thought (the whole point of coast down test is to simplify the whole deceleration calculation it seems) and I came up with the attached worksheet.
Problem is, using the values adopted in the dynapack screenshot from my previous post, the deceleration seem to be too slow (also found a few papers with similar numbers to confirm those used in the dynapack screenshot is typical). I think I might just be using the wrong units or something in my formula? but I cannot figure out the error.
Ok, I think I have worked out the error.
Units for F = MA or A = F/M is in meters per second rather than KM/s, so I needed to multiply the deceleration rate by 3.6 to obtain the correct value in KM/h.
Attached is the updated worksheet.
I just made the update. The Gearbox Simulation graph changes correctly according to the road load parameters. But the F2 and F3 road mode behaves strangely. F2 road mode doesn't produce any load at all. In F3 Acceleration Mode if I step suddenly to full throttle rpm jumps about 2000rpm and then it settles to steady-state rpm. if I increase the Throttle slowly RPM increases until I reached full torque of the engine.
How do these two modes operate on your Dynapack?
Hello Adrian, we have only received the update last week and I have not gotten around to testing the road simulation yet. The dyno is currently used by another tuner at the moment so we are unable to test it until next week. Will report back once I do.


