225 | Circuit Racing Data Analysis
Summary
If you want to get the best results out on the race track then data analysis is essential. Data analysis can be used to assess the state of tune of the engine, as well as engine health and driver performance. In this webinar we’ll look at some simple ways to monitor your engine at a glance and improve your lap times using MoTeC’s i2 Pro analysis software.
| 00:00 | - Hey guys, Andre from High Performance Academy here, welcome to another webinar. |
| 00:04 | Now this time we're going to be covering some of the basic techniques around data analysis and specifically we're going to be looking here at a slightly diverse topic for High Performance Academy which is more along the lines of improving your lap times at a racetrack and we're going to be looking at how we can analyse our data, what we should be looking for in order to do so in a time efficient and cost effective manner. |
| 00:31 | Now we're also going to be using this same data for a variety of other purposes which we're going to be just briefly touching on as well. |
| 00:40 | So there's something here for just about anyone, regardless whether you're interested more in the aspect of optimising the engine performance or you're interested in optimising your lap times, the two do go hand in hand and we're going to be looking at a lot of the same information. |
| 00:55 | To start with though we want to take a step backwards and kind of just cover off what is data analysis and why do we need it? And really this comes down to just having some kind of central logging hub inside of our vehicle, that's responsible for gathering data as we drive around the track. |
| 01:13 | Now the reason that this is beneficial is because it can be really tricky for us to remember exactly what went on on any particular corner of any particular lap and particularly if you have been out on the track for a 20 or a 30 minute session, you're going to be doing a lot of laps. |
| 01:31 | Every lap's going to potentially be slightly different and it's going to be tricky for you to come back after that 20 or 30 minute session and decide well I did this particular thing on this corner and on this lap and it really worked well so obviously that's the best technique for approaching that corner. |
| 01:47 | So data analysis is just sitting there like a silent big brother while you're driving the car, gathering all of that data and as they say the data never lies, so with the ability to then analyse that data in an efficient format, once we get back into the pits, out of the car and we've calmed down a little bit, gives us a great platform for reviewing exactly what's going on so we can make some more informed decisions about what to do with our driving or what to do with the car. |
| 02:18 | Now there are a variety of options for gathering this data and that's important to understand as well and I think as technology's improved and our ECUs have come a long way, we've seen more varied options, particularly in this respect and this gives us some cost effective options as well because a lot of the systems that we see, particularly in professional motorsport use, they can be prohibitively expensive for the average home enthusiast. |
| 02:46 | So that's, we're just going to talk about what those options are and what they look like. |
| 02:51 | So first and foremost, and if budget is going to allow this, probably my personal preference would be to use a dash logger. |
| 03:02 | And this is normally a logger and a display built into one. |
| 03:05 | We'll just head across to my laptop screen for a moment and this is a terrible photo, I will apologise but this is the gauge cluster on our Toyota 86. |
| 03:15 | We're definitely going to need to clean this before we go racing but this is our MoTeC C125 dash logger mounted up there. |
| 03:23 | And this is in behind the plastic factory gauge cluster so essentially just replacing the stock gauge cluster, all looks relatively subtle from the outside of the car. |
| 03:32 | And it just mounts that dash logger in that location so we can easily see all of the information on it. |
| 03:40 | So this, as I mentioned, doubles as a driver display, we've got all of the information that we need on that display including a shift light module and driver warning alarms as well. |
| 03:51 | But then the key aspect from our perspective for today's webinar is the fact that it can then datalog all of the inputs to the dash so we can analyse them at a later point. |
| 04:01 | Now the problem with this is, as I've mentioned, these can be quite expensive, not 100% sure exactly what the retail on a C125 is at the moment, it's obviously going to depend where abouts in the world you are but depending on exactly which model and options you go for, you're probably looking somewhere in the region of maybe USD$3000-4000, might be a little bit cheaper than that but you sort of get the idea. |
| 04:27 | Obviously this is a MoTeC product, there are a wide range of different options from different manufacturers as well and they obviously vary in terms of the functionality and they also vary in terms of their price points. |
| 04:41 | The reason that I've shown you this MoTeC C125 here is for today's webinar we will be concentrating on using the MoTeC i2 Pro analysis software. |
| 04:51 | Everything I'm going to be talking about though will cross over quite nicely to most of the data analysis packages. |
| 04:58 | They all kind of, for the most part, do much the same thing. |
| 05:01 | The user interface might be a little bit different, the menu structure is obviously different but the actual analysis techniques that we're going to be talking about today will apply regardless what you are using for analysis. |
| 05:13 | Alright so that's number one option, your dedicated dash logger. |
| 05:17 | Moving on, the other option that we've got here is a portable dash logger. |
| 05:24 | Now the one I've got here is an AiM Solo 2 DL. |
| 05:27 | So I'll just see if we can have a look at this under our overhead camera. |
| 05:31 | So straight away, hopefully you can see it is incredibly small. |
| 05:35 | And it actually packs a huge amount of power into this little unit. |
| 05:39 | One of the advantages with it is that it is portable. |
| 05:42 | So what I mean here is that you can move it from one car to another and in terms of doing that, there's a variety of ways of doing that but here we've got a little suction cup mounting kit that AiM also sell as an optional accessory. |
| 05:56 | So these units, this is the AiM Solo 2 DL, they also do a AiM Solo 2. |
| 06:03 | The difference between the two is the DL allows you to integrate data from your ECU via CAN. |
| 06:11 | So not strictly necessary but as we move through today's lesson, you're going to see that it is a powerful addition if you can get some of your data from your ECU. |
| 06:22 | So again this is going to depend cost wise on where abouts in the world you are. |
| 06:26 | I think for the basic AiM Solo 2 you're probably somewhere around about the USD$500 mark give or take. |
| 06:35 | So it'll be there or thereabouts. |
| 06:37 | But obviously a much cheaper option than a dedicated dash logger. |
| 06:42 | Now this uses GPS as well as a built in three axis G sensor so it can do track mapping and it can give you lap times. |
| 06:50 | The advantage with having this is a driver display as well. |
| 06:53 | You can mount it somewhere in your peripheral vision, it will give you your lap time as you go across the start/finish line. |
| 06:59 | It will also give you gain or loss functions which we're going to talk about so don't worry too much about that. |
| 07:05 | And you can also use the lights on either side of the unit to give you a visual indication as to how well you're doing there. |
| 07:13 | So pretty cost effective and for the average track day enthusiast as well, it's at a price point where you could probably go in with a couple of mates and share the cost of the unit and then share it out between different cars because it is so quick and easy to move between different cars. |
| 07:31 | Then we also have the ability now with a lot of the ECUs to do your datalogging directly into the ECU. |
| 07:39 | This is common on just about every standalone aftermarket ECU that we deal with. |
| 07:45 | The key difference is that in most instances, the sort of data analysis that is used inside of the ECU is more around generally optimising the engine performance. |
| 07:57 | So in order to be able to get useful data for circuit racing analysis we really want to get GPS data into there or at least a timing beacon, we'll talk about those too in a moment, so that we can get lap times, we can basically split our big chunk of data up into individual laps 'cause that's the real powerful aspect of it. |
| 08:18 | That's definitely possible with some ECUs but it's not with others so you do need to be a little bit mindful of that. |
| 08:25 | The last option is that there are enclosed standalone loggers, essentially a little bit like the dash logger option except without a driver display. |
| 08:34 | Understandably these are usually a little bit more cost effective. |
| 08:38 | Sometimes they also give the option for larger numbers of inputs to the datalogger and a larger memory capacity for storing more data as well. |
| 08:48 | So few options there just depending on what exactly you're trying to do and also depending on what exactly your price point or what your budget, I should say, is going to be. |
| 09:02 | Now just before we move into the data analysis I just want to come back to mention the driver display because there are really only a couple of aspects that we're going to be relying on from the driver display. |
| 09:15 | We'll just go back to my laptop screen for a moment. |
| 09:17 | And we've got a lot of data being displayed up here on the dash so obviously we've got our gear, we've got our speed, we've got our fuel remaining, we've got our lap time and our engine RPM. |
| 09:28 | Almost none of that we're going to really be paying any attention to when we're out on the track, pushing really hard and under normal circumstances, while it's a little bit hard to see, we've got this shift light module that is up above the dash and that's really the main input that the driver is going to be relying on. |
| 09:42 | Basically all we want to know is what is our RPM, when should we be pulling the next gear? But the other aspect with these dash loggers is that we can bring up driver warnings if something goes outside of the normal values that we're expecting to see. |
| 09:58 | Let's say our engine coolant temp's getting too hot, maybe our oil pressure drops too low and in that instance we can bring on a driver warning. |
| 10:05 | So this is a really powerful aspect of these dashes. |
| 10:07 | I'm not going to dwell on it, if you want to learn more about driver warnings, you can check out our webinar in the archive that covers driver warnings, you'll learn all about what they are and we'll show you some examples of how you can set them up. |
| 10:19 | But I just want to mention this because it can on face value seem that these are just over priced. |
| 10:25 | It really only takes a driver warning to save a $10,000 or $15,000 race engine and all of a sudden these can actually seem really really valuable. |
| 10:33 | So yeah again, if you want to learn more about driver warnings then check out the webinar that we cover those in, in the archive. |
| 10:43 | Alright so let's talk a little bit about the sorts of inputs that we're going to need into our data analysis package or our data logger so that we can actually do a decent job of understanding what's going on and make some educated decisions about what changes to make to our driving. |
| 11:00 | So I've separated these into what I consider to be critical inputs and then more advanced or maybe you'd like to call them optional inputs. |
| 11:10 | And obviously a lot of data is going to give us the ability to do more in depth analysis, maybe make better decisions but particularly to the novice enthusiast just getting started down this path, what you actually find is that more data often ends up actually confusing matters. |
| 11:27 | What we can actually do is a really good job of analysing the driving of the driver's driving lines et cetera and performance out on the track with a relatively modest data set, so we'll cover that first. |
| 11:39 | The first thing we're going to need is some way of getting lap time into our data logger. |
| 11:45 | Now there's two ways we can generally do this, one is with a GPS antenna. |
| 11:51 | A GPS antenna is going to give the data logger our GPS location on earth. |
| 11:58 | So basically by entering in GPS locations for the start/finish line, the data logger will then know when we've gone over the start/finish line and will be able to basically give us lap times from that. |
| 12:10 | The other option of doing this is with a timing beacon. |
| 12:14 | So this is something that we still see, it's definitely more accurate ultimately than a GPS antenna. |
| 12:20 | But the timing beacon is a little bit more cumbersome. |
| 12:23 | What we've actually got is a transmitter out on the side of the track. |
| 12:27 | So we physically have to put a transmitter out on the side of the track, pointing across the track We'll then have a receiver on the car, these are generally infrared, and basically when the car goes past the timing beacon, the logger will then register that the lap has started. |
| 12:43 | So one of the big problems with this is that you've got to make sure that your batteries for your transmitter are charged, you've got to remember to put the timing transmitter out, the beacon out on the side of the track. |
| 12:54 | I mean that might sound self explanatory and go without saying but it's easy to forget. |
| 12:59 | Probably the more troublesome aspect is you've also got to remember to go pick that transmitter up at the end of the day's racing, otherwise you're leaving a fairly valuable transmitter sitting there for anyone to pick up and walk off with. |
| 13:10 | So while it is the preferred way if you really want accurate timing data, we're seeing basically more and more now, GPS has become the norm. |
| 13:21 | It is important to say that in general, the 10 hertz GPS, there will be potential for some error. |
| 13:27 | In normal circumstances, I see the GPS timing from our cars line up with the transponder in the racetrack to within better than a 10th of a second, probably more often within 5/100ths of a second. |
| 13:41 | So we're pretty damn close, definitely close enough for the average home enthusiast. |
| 13:47 | So once we've got that GPS antenna in, that's going to give us not only our lap times but the ability to do track mapping. |
| 13:53 | That's going to be our norm. |
| 13:55 | The other alternative, there is another way of doing track mapping. |
| 13:58 | If you're not going to use GPS, it does get a little bit more involved because you need the beacon so we know where the start/finish line is, you need lateral and longitudinal G force, we need those anyway but let's get onto that in a second. |
| 14:11 | But the other input that we do need for doing track mapping with our GPS antenna is you're going to need a wheel speed so that the logger can work out track distance as well. |
| 14:24 | So a little bit more involved. |
| 14:26 | So basically GPS for the most part, that's what we're going to be using. |
| 14:29 | And again if we've got something like the AiM Solo 2 that's got build in GPS. |
| 14:34 | Alternatively if you're not using a system like that, there are a variety of GPS antennas that you can purchase that you can then wire in to your logger to provide a variety of GPS data including the GPS position speed heading, time, date, number of satellites seen et cetera. |
| 14:57 | So next input that we're really going to need is speed and I've kind of already touched on this here. |
| 15:03 | If we've got a GPS input, we're going to be able to infer the speed from the GPS signal. |
| 15:08 | Now it isn't the best actually if we're going to be looking at a speed signal. |
| 15:13 | There is some inaccuracies inherent with GPS dependent on where abouts in the world you are, some places it can be quite bad, but really this comes down to access to the number of satellites overhead. |
| 15:25 | The more there are, the clearer vision the GPS antenna has of these, the more accurate your speed signal's going to be. |
| 15:32 | But generally there is also going to be, particularly if you're using a 10 hertz GPS, a little bit of lag with the GPS speed signal so my preference there, if at all possible, the most accurate way of getting this information is directly from a wheel speed sensor. |
| 15:49 | That does get to be a little bit more advanced but let me get onto how we can get that in shortly. |
| 15:53 | And then the other inputs that we're going to need is absolutely critical, our lateral and longitudinal G force. |
| 16:00 | So again most of these little dash loggers and loggers like the AiM Solo 2 have the G force sensor built in. |
| 16:08 | So you're getting all of that information relatively quickly and easily without the need to do anything too elaborate. |
| 16:14 | Talking about some of the additional sensors that are going to give you a lot more information, it'd be nice to have throttle position so we can actually see what the driver's doing on the throttle. |
| 16:24 | At the same time, engine RPM is also useful, we can see how well the driver is using the range of the engine RPM. |
| 16:32 | We can also see how well the gearing is matched for a particular track. |
| 16:35 | Then we can look at steering angle, that's going to tell a lot about the behaviour of the chassis, whether it's understeering or oversteering, how hard the driver's working to control that. |
| 16:45 | Break pressure sensor's another great addition, we can then analyse the braking performance of both the driver and the car. |
| 16:53 | If we've got a race brake system with a dual circuit brake balance bar, basically if we've got a pressure sensor for the front circuit and the rear, we can also analyse the brake bias between the front and the rear wheels. |
| 17:09 | And then starting to get into the more advanced sensors like damper position which are well beyond the scope of what we're going to be talking about today. |
| 17:16 | It is important to say here, there is literally an endless list of potential sensors that we can add to the car. |
| 17:23 | All of these sensors add complexity, they all add cost and one of the things I find is that while, yes it is nice to have access to all of this data, when you've got hundreds of individual channels of different sensors coming in, it can be very very easy to actually get yourself confused. |
| 17:40 | So again I really come back to often less is more here. |
| 17:43 | Start with the basics, that's going to be what I'd consider the low hanging fruit of improving your lap times. |
| 17:50 | Once you're starting to get to the point where you've got the big gains in lap time, you've found the half second or second and a half per lap and you're starting to get down to improving to the 10th or a few 100ths, that's when starting to add some of these more advanced sensors can pay dividends. |
| 18:07 | Alright so now I want to talk about where we can actually get this data into the logger from. |
| 18:16 | And there's a variety of ways we can do this depending on the particular unit that you're using. |
| 18:21 | If you are using an ECU, a dash logger or an enclosed logger, then almost inevitably, you're going to be able to wire sensors directly into that particular unit. |
| 18:30 | These will be in the way of analog voltage sensors. |
| 18:34 | So sensors that provide a varying voltage as a particular signal, let's say manifold pressure changes, analog temperature, where the resistance of the sensor changes in relation to changing temperature. |
| 18:47 | Then we've got digital signals which can be frequency based so a classic example of that would be something used for a wheel speed or a driveshaft speed sensor. |
| 18:57 | And then, this is really where we've seen the whole systems become so much easier and cheaper to configure these days is where we can bring data into the logger via CAN or controller area network. |
| 19:12 | A simple two wire bus that runs between our different computers in the car. |
| 19:16 | So a good example of that here would be our AiM Solo 2, this is the DL model and the AiM Solo 2 DL allows you to bring inputs into the unit via CAN. |
| 19:30 | So by wiring that into the little connectors on the bottom there, you can bring in a data stream from just about any popular aftermarket ECU that has a CAN template that sends out data. |
| 19:42 | So straight away that gives you access to all of the information that's going into your ECU with just a simple two wire bus. |
| 19:50 | So for example you've got engine RPM, you'll have wheel speeds, you've got throttle position, coolant temperature, intake air temperature so it really vastly increases your ability to analyse data without needing to double up on all of those sensors. |
| 20:04 | Same can be said for any of the popular driver dash loggers as well, those all have exactly that same functionality. |
| 20:13 | Alright so we've sort of got to a point where we've covered the basics there, you know what data analysis is, you know what the sort of inputs that we're going to need to analyse to analyse are and how we can get that information into our logger and we're going to move into the actual data analysis which is the key to obviously this webinar. |
| 20:31 | Now I should mention as well, we're going to have questions and answers as normal so if you've got any questions about any of this, please ask those in the comments and we'll deal with those shortly. |
| 20:39 | So really when it comes to data analysis, I break this up into three separate areas. |
| 20:43 | We've got engine analysis. |
| 20:45 | So this is looking at the engine critical aspects, so oil pressure, temperatures, maybe our exhaust lambda as well, manifold pressure in a turbocharged engine. |
| 20:56 | And this is about making sure that our tune is safe and that our engine is healthy. |
| 21:00 | Now we have dealt with this in a previous webinar so again if you are interested in learning a little bit more about that, 'cause I'm only going to briefly touch on that today, then check out our archive. |
| 21:10 | If you just use the search term "data" you will find that webinar. |
| 21:14 | The next aspect is the driver so analysing the driver performance and that's what we're going to be focusing on today. |
| 21:21 | The third element is chassis which is something that's a lot more advanced and potentially something we'll look at in a future webinar. |
| 21:29 | Now it is really important before we head to the track, ideally before we head to the track, at least before we head out on the track, it's always a good idea to make sure that your data analysis setup is all zeroed, calibrated, everything is set up and functioning normally. |
| 21:47 | So in terms of this, what we want to do is make sure all of our inputs are calibrated. |
| 21:51 | So we're actually getting sensible values for all of our inputs, be they engine coolant temperature, or a damper position, we want to make sure that all of that makes sense. |
| 22:01 | The other aspect that goes kind of hand in hand with this is that we will have a number of inputs that we need to zero. |
| 22:08 | So G force is a good example of this and one that a lot of people overlook. |
| 22:12 | Particularly if the G force sensor is mounted in a dash logger, then you can see this if you're watching the G force as you move the dash before it's mounted in the car. |
| 22:22 | As you move the dash, it essentially will show you a G force reading. |
| 22:26 | So what we need to do is once the dash is mounted and our car is on level ground, we want to zero the lateral, longitudinal and vertical G force sensors so that the readings that we're actually going to get when we're on track are sensible. |
| 22:39 | The same goes for our throttle position sensor, damper position if we're running those and steering angle. |
| 22:45 | Basically we want all that information to be accurate. |
| 22:47 | So we're not trying to analyse around potential problems that we've kind of baked into that data. |
| 22:54 | The other aspect here, and this is another place that I see so many of my old customers kind of make their lives more difficult than they need to be is in data handling. |
| 23:04 | So we're going to be creating a lot of data, we're going to be creating a lot of log files, particularly if you're going to a variety of different tracks, they will be split up over the different tracks that you're going to be visiting and you're going to want to be able to come back and compare to previous data logs from that same location, perhaps you go to a track and it's wet, you want to pull up data from the previous time you ran at that particular track and it was wet, or if you're analysing a suspension change, you want to look at what you did last time with your old suspension under the same conditions. |
| 23:38 | So it's really important just to give a little bit of thought to how you're going to handle your data log files. |
| 23:44 | So let's just have a quick look here at, yeah let's just jump across to my laptop screen here and we'll have a quick look at our MoTeC C125 dash logger setup for our Toyota 86. |
| 23:59 | So when we open this, or we're sending a configuration through to the dash or we're retrieving log files, we're going to end up with this box basically pop up, asking us to fill in the current details. |
| 24:11 | So again, depending on the logger you're working with, the specifics may be a little bit different but essentially the process is still going to be comparable. |
| 24:20 | So what we're going to do here is we're going to event name. |
| 24:23 | So in this case I'm setting up here for our South Island Endurance Racing Championships round four, the first of the days that we're going to be racing here will be a practice day so obviously I've just labelled that. |
| 24:35 | And I've pre empted this, we're going to be session one, is our session name and then a short comment just so at a glance we can kind of see what we were doing there, so we're going to be bedding in a set of fresh pads. |
| 24:45 | Then you can add in a longer comment. |
| 24:48 | So this is quite useful if you've made some specific setup changes here you can really give a quick rundown on what those changes are so that at a glance you can figure that out. |
| 25:01 | Then we've got our venue so this isn't actually correct at the moment, we've got Highlands Motorsport Park, obviously we're going to select our venue. |
| 25:08 | Here we've got our GPS coordinates for our start/finish line and then our logging directory here. |
| 25:14 | Which actually at the moment I've got set to desktop which is not really where we're going to want to store all of our log files. |
| 25:20 | So generally what I'll try and do here is for each particular track, I'm going to have a master logging folder on my C drive and for each particular track I'm going to have a sub folder for that particular track and then we can also select the particular vehicle that this log file will be attached to. |
| 25:37 | Now this just means that at a later point we then can really quickly zero in on a particular file that we're interested in so we can go, oh I want to go to this particular track, go to that folder, all of the information from that track is available. |
| 25:51 | Then you can filter that based on a particular vehicle or you can filter it based on date and time or even fastest lap. |
| 25:59 | So it just makes it really easy for you to analyse data later on and you will be creating a lot of these files so it really makes a lot of sense to just give some thought to that before you get too far down that rabbit hole. |
| 26:13 | Now another aspect that I'll just mention here is that it can be a benefit if you actually use something like Google Drive to back up your files there. |
| 26:25 | There's two ways you can do that, you can use Google Drive as your directory folder for storing these files, that's what I normally do. |
| 26:34 | Or alternatively you can use a software package like SyncBack in order to sync between your laptop and Google Drive. |
| 26:40 | This means that the data is going to be available to multiple laptops and it also means that if your laptop gets damaged, you're not going to lose all of your log files. |
| 26:50 | Alright so now that we've dealt with that, we can actually move into analysing the data. |
| 26:58 | So let's just have a quick look here at our MoTeC i2 software. |
| 27:03 | I'll just get rid of our overlay lap. |
| 27:06 | And I'll give you a quick tour. |
| 27:08 | There's a lot of flexibility in how we set this up so how I've got this set up right here is not going to suit everyone. |
| 27:15 | And you can go ahead and make whatever changes you need until you're seeing the data in a way that makes sense to you. |
| 27:23 | In particular here, with our i2 Pro, if we go over here to the left hand side, we've got a little drop down box here, we can separate our data into different areas for analysis. |
| 27:35 | So for example we've got our samples workbook which has just some relatively basic data, again, you can have this set up to show whatever you actually want. |
| 27:47 | Then we move down, we've got our driver, so this has a number of worksheets that are kind of set up already to help analyse the driver's performance. |
| 27:58 | Then we've got our engine, transmission, brake suspension and tyres. |
| 28:03 | So obviously what you've got available there is also going to depend to a degree on what your sensor package is, so how many sensors have you got on the car? Obviously you're not going to be able to do a lot of analysis of your tyres if you don't have a tyre temperature or a tyre pressure monitoring system fitted to the car. |
| 28:23 | Alright so one of the first places, even though we are talking today about our driver performance, one of the first places to start is always to have a quick look over our engine vitals and the reason that it's important to make sure that our engine is doing what it should is that we want to make sure that it's actually going to run for our next outing, our next session. |
| 28:43 | Doesn't really matter how good the driver is, if the engine has low oil pressure and it's about throw three rods through the outside of the block, yeah doesn't really matter how late you went into the brakes into turn two because the motors cooked and that's going to be the end of your day. |
| 28:58 | So the sort of things that we're looking at here would be our oil pressure, our fuel pressure, our lambdas and there's a few different ways we can analyse that. |
| 29:06 | Again we've got different worksheets for looking at this, we've got our oil pressure for example being displayed here. |
| 29:13 | So graphically you can really quickly at a glance see what our minimum is. |
| 29:18 | So you can see here we've got a few little drops here but nothing that I'm worried about because they also coincide with our RPM being low and we know that our RPM and our oil pressure are all going to be matched. |
| 29:31 | We've got our, I don't actually know if I've got this set up. |
| 29:36 | We've got our mixture here, so we can have a quick analysis of our air/fuel ratio. |
| 29:40 | In particular here for circuit racing, one of the things we're going to be looking at predominantly is how close are our lambdas under wide open throttle? So we'll choose and area of the track where we are under full throttle acceleration and we can see that our lambda there is where we want it to be, so that's pretty good. |
| 29:57 | Then again another way of analysing our oil pressure, we can look at our samples of oil pressure relative to our engine RPM. |
| 30:05 | And that's probably about all we really need to look at so fuel pressure, oil pressure, air/fuel ratio, temperatures as well is the other one that we want to have a quick look at there and make sure our engine coolant temperature, our oil temperature, maybe our intake air temperature are all sort of under control. |
| 30:23 | Again if you want to get a little bit more involved with this as well as have a look at some more advanced ways of analysing a lot of data really quickly, then the data analysis, the other data analysis webinar in the archive is going to be perfect for you. |
| 30:36 | Alright so once we know that our engine isn't about to lunch itself, we can then get into our driver analysis. |
| 30:44 | So one of the the most powerful functions, regardless of what data analysis package you are looking at is the idea of a reference lap. |
| 30:53 | So the reference lap is a way of getting a really good representative lap time, getting the data from that lap time and then using that to analyse a further or subsequent lap. |
| 31:05 | Now there's a lot of ways we can do this with our reference lap. |
| 31:09 | One of the smartest ways to start, particularly if you are just a weekend warrior, maybe you're getting to the track once every sort of two or three months and just doing a track day, then it's a really good idea if you spend a little bit of money and engage in the services of a professional driver or driving coach. |
| 31:27 | And basically what I'd suggest here is get them out in your car, give them a session of sort of 15 laps or so to really get familiar with the car. |
| 31:35 | Most professional drivers, you will actually be surprised how quickly they can switch on and get used to a new car. |
| 31:40 | They'll probably be doing representative lap times within a 10th of what the car's capable of within the first five or so laps. |
| 31:47 | And basically once the pro driver has then got a lap time that they feel is representative, you're going to have that lap time in your data logger, you can save that as a reference lap and then you can use that for analysing your own driving. |
| 32:00 | Now, there's another way, once you've got that reference lap as well that you can use that data which is really powerful, you can actually send that reference lap through to your logger, particularly if you've got a dash logger or something with a driver display, some of these will do this and update the best lap time automatically and then you can use what is called a gain/loss function as well as predicted lap times. |
| 32:24 | So we'll just head back over to my laptop screen and I'll show you this. |
| 32:30 | So that's exactly what I've got shown here so on the left hand side we've got our lap gain/loss and then we've got our lap time predicted on the right hand side. |
| 32:38 | So basically what this does is as you start your lap, the GPS is telling the dash logger where abouts on the track you are. |
| 32:47 | It's comparing in real time to that reference lap and it's showing you whether you're ahead or behind on that reference lap. |
| 32:55 | So you'll be able to watch basically every time you get a spare moment, maybe on a straight piece of track, you can just glance at the lap gain/loss and you can see in real time whether you're improving on or you're doing worse than the reference lap. |
| 33:10 | That can be really powerful, maybe not so much when you are using the reference lap from a pro driver but when you're at a point where you're kind of trying to improve on your own lap times and you're using your own reference laps, this can be really powerful when you're trying a different line through a particular corner, you can look at your gain/loss prior to that particular section of the track, try something through that particular section of the track and then immediately look at your gain/loss afterwards and see if you actually saw a perceptible improvement or maybe you went backwards. |
| 33:39 | The other way I use this is in qualifying, if you've just bolted some fresh rubber onto the car, obviously you don't want to beat up on that rubber and wear it out prematurely so if you are on a flying lap and then something goes wrong, maybe you make a small mistake or maybe you catch some traffic and you see your lap gain/loss is showing that you're negative on your previous best then you're probably better to throw that lap away, reset and get ready for another flyer as you go across the start/finish line, rather than just needlessly beating up on your rubber. |
| 34:13 | The lap time predicted, pretty self explanatory, that's going to show you what the predicted lap time is, based on your lap gain/loss and how you're doing out to that point on the track so really powerful. |
| 34:25 | Admittedly under race conditions, you're unlikely to be able to pay too much attention to either of those aspects. |
| 34:32 | It's just more about driver training, qualifying and practice sessions, you can take note of this and try making changes to improve your situation. |
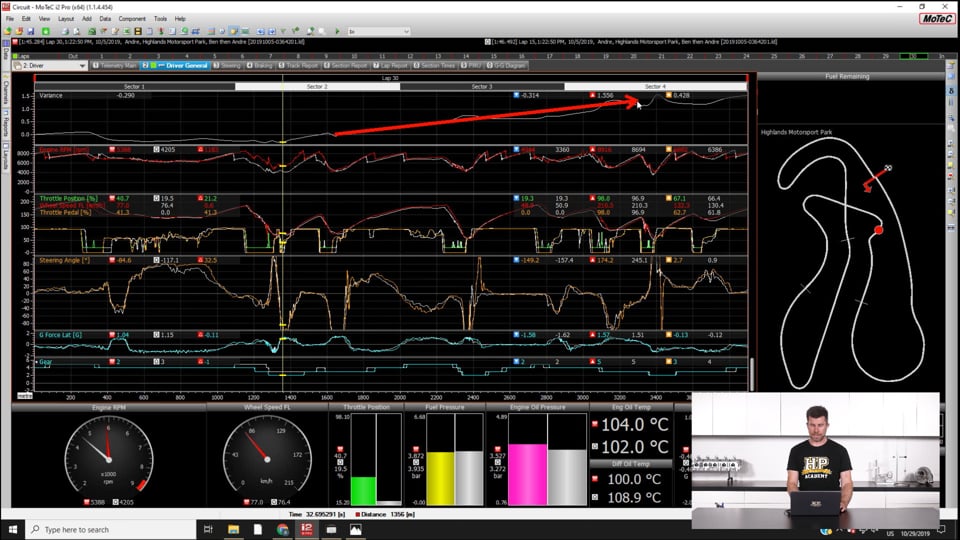
| 34:45 | Alright so back to our i2 Pro data analysis package. |
| 34:50 | We are on our driver general worksheet at the moment and we've got a bunch of information that is pertinent to what the driver's doing. |
| 34:59 | We've also got a track map out here on the right hand side that is showing where abouts we are on a particular track. |
| 35:07 | Now in this instance, the amount of data or the type of data that you're going to want to visualise here is going to depend on what you're trying to do. |
| 35:16 | What we've got here is our engine RPM in our top group. |
| 35:19 | We've got throttle position, wheel speed in our next group down. |
| 35:23 | You'll notice I've got throttle position and pedal position. |
| 35:26 | Subtle aspect here because this is a drive by wire throttle equipped car. |
| 35:31 | So in most instances, one of those will be sufficient. |
| 35:34 | Then we've got our steering angle and then we've got our lateral G force and we've got our gear. |
| 35:43 | So these will be pretty typical places to start with our analysis. |
| 35:47 | One thing that is important to mention here is the axis that we are using for our analysis. |
| 35:54 | So we can see the x axis down here is distance, so it's actually showing metres as we go around the track. |
| 36:02 | And we've got the ability up here on the tool axis, we can switch between time or distance for the horizontal axis. |
| 36:11 | And it's particularly important when we are analysing two laps over the top of each other, we really want to analyse these using distance as the x axis because what we want to do is know what we did at a particular point on the track and in particular if we've got quite a large lap time difference, the thing that happened at a particular point on the track is going to end up in two different areas of our data log so it's really difficult to compare them directly. |
| 36:38 | The larger the variance in our lap time, the further apart those particular areas are going to be so for example if we're trying to analyse what our mid corner speed was at turn four then we really want to do that on distance because the middle of turn four, the apex of turn four is going to happen at two completely different points in our data log if we are using our time base there instead. |
| 37:04 | OK so what we want to do is now look at how we can analyse a lap in relation to this lap. |
| 37:11 | So let's say this is our reference lap here, this is what we've considered to be a really good lap, maybe our pro driver set this and what we want to do here is go into our data and choose another lap to compare against. |
| 37:23 | So in this case the reference lap that we've got there is 1:45.284, we can see that is the lap that is highlighted there as our main lap and then let's take our lap 15 there, 1:46.492 as our overlay. |
| 37:40 | So what we can do is click there and add that as an overlay lap. |
| 37:44 | We can actually in i2 Pro add multiple laps as overlays but it starts to get really messy and difficult to analyse the data so let's just keep things as simple as we can. |
| 37:54 | Now that overlay lap there is going to load up with all of the data shown in grey. |
| 38:00 | Now if we're looking at it like this, it's still pretty difficult to deduce much about what's going on and decide on where abouts the improvements came from the 1:46 to a 1:45. |
| 38:13 | But this is where the variance channel or variance function comes in. |
| 38:17 | So in MoTeC i2 if we press the F3 key, this will bring up our variance channel up the top. |
| 38:25 | So this is really what we, one of our first go to's when are trying to analyse the difference between two laps and essentially what it does is it just shows us the variance in time, cumulatively as we go around the track. |
| 38:38 | So for example here, we've got our zero axis that we can see, oh not like that, try again, we've got our zero axis that we can see through here. |
| 38:50 | So any time the line is below, our variance line is below this, it shows that in this case our overlay was actually doing better than our reference lap. |
| 39:00 | Any time the line is going upwards as we can see here, that means that our reference lap is an improvement. |
| 39:08 | So the quickest way to analyse this, what we're looking for is any areas or the areas where we're seeing the biggest variance or change in variance so any time we've got a really steep variance which we can see through this section here. |
| 39:22 | So this is an area where we were losing a lot of time compared to the reference lap, so then we can start digging in a little bit deeper and find out why that is. |
| 39:32 | So let's have a look at exactly what was going on, basically from this section here, all the way through to this section here. |
| 39:41 | So when we're analysing this data, a good way of looking at it is to use the speed trace because obviously everything that we're doing in the car is all about trying to improve speed. |
| 39:53 | So the speed trace is really telling us how well we're doing there. |
| 39:57 | Obviously if we're going faster, the car's lap time is going to be better. |
| 40:00 | So if we look here, this is what we've got. |
| 40:04 | Our red trace here is our speed trace from our reference lap and the white obviously is the speed trace from our overlay. |
| 40:12 | So in particular here you can see that at just about every section through this area, the red trace from our reference lap has more speed than our overlay. |
| 40:23 | So if we click at a particular point here, we can see that our wheel speed was 148.7 for our reference lap, our overlay, And it also shows us the variance there so basically at that particular point in our log file, there's a split of 6.5 or delta of 6.5 kilometres an hour which is pretty significant, particularly if we look at this point here our delta and speed is 20.2 kilometres. |
| 40:53 | So this is showing us what we basically need to focus on, then we need to try and figure out why that's the case. |
| 41:00 | So if we look here, let's just move over a little bit. |
| 41:05 | What we can see here, this particular area, what we're looking for is why the car was going faster. |
| 41:13 | So keys for this would be, is the driver reaching full throttle? What we might do here is just get rid of our throttle position trace to make this a little bit clearer. |
| 41:24 | So this is just now showing the driver's foot pedal position. |
| 41:26 | So we'll get into the middle here. |
| 41:28 | So what we're looking at is through this section of the track here which is a sort of a chicane section, we can see that our red reference line is just a little bit faster there, about 1.5, maybe half a kilometre an hour faster. |
| 41:44 | And we can see that as the driver comes through the left hand section here, the driver in the reference lap which is the orange throttle position trace, starts to get back on the throttle, so the throttle is higher there than the overlay lap, in the overlay lap the driver's completely off the throttle. |
| 42:05 | So of course because the driver is accelerating, we see the knock on effect, a very short time later where now we're up to a variance in speed of 4.2 kilometres. |
| 42:15 | Now the driver in the overlay lap actually does get to full throttle marginally earlier than in our reference lap but by then it's too late, the car's already accelerating and what we see is basically from this whole section here, the speed in our overlay, on our reference lap is higher and that's why we see that variance continue to increase. |
| 42:38 | Now we see that also if we analyse this a little bit further, when we get to the braking position for this turn here, we can see that the driver rolls off the throttle a little bit earlier as well. |
| 42:52 | So he's rolled off the throttle in this case, we can see 1556 metres versus 1553 metres, so basically he's got off the throttle onto the brakes three metres earlier as well, so braking a little bit earlier and again we see that the speed basically is held right through that section of the track. |
| 43:13 | So if we go back here, we can see that that just continues and we've also got a big variation in our speed through this long sweeping left hander here. |
| 43:24 | And this is basically being caused by the fact that the reference lap here in orange, the throttle position on average is just a little bit higher than our overlay lap and that's being shown because that's been, the upshot of that is that we end up increasing our speed. |
| 43:44 | So again, that variance channel show us where to look in our datalog at a glance in terms of where are the big gains to be had, where are we losing the most time? From there we can look in a little bit deeper, the two channels that I'm looking at there, our wheel speed to see where the car was faster and then we're analysing our throttle position trace to see why exactly that was the case. |
| 44:06 | Now if we zoom back out, we do need to be a little bit mindful of relying soley on our variance channel or analysing it without understanding its implications. |
| 44:16 | So let's have a look at this particular section here. |
| 44:20 | So you'll remember I said that any time we've got a sharp increase in our variance, this means that we've got the potential to make up a lot of time. |
| 44:29 | So this particular section here, we are breaking into a hairpin right hander and we can see that, this particular point here, the driver in the reference lap again has braked quite a lot later than the overlay lap and carried a lot more speed down into this particular corner. |
| 44:50 | So what that's done is we've seen this sharp increase in the variance. |
| 44:55 | So that looks on face value like a good thing however you'll also note that the variance then plateaus and as the car comes out of the hairpin corner, we actually see that that variance starts to drop away again. |
| 45:11 | So we've actually, we've made some time coming into the corner but we've lost time on the corner exit. |
| 45:17 | And this is really shown, again what we can do is we can look at our speed traces to get a bit of an idea of what's going on here. |
| 45:24 | Actually what I might do here is just split these because it might just make it a little bit easier for us to see what's going on, so let's just split our wheel speed and our throttle position, yeah that's going to be better. |
| 45:38 | Alright so the driver in the reference lap here has carried a huge amount more speed which is this area here, into that hairpin. |
| 45:47 | 12.8 kilometres is our delta coming into the apex of the corner. |
| 45:51 | The problem with this is it's compromised the corner exit. |
| 45:55 | So the car's been faster to the corner entrance but the car hasn't been able to get turned in properly, it's carried too much speed, understeered wide and that's compromised the corner exit because the corner exit is now tighter. |
| 46:07 | So what we can see here, at this point here the delta is basically nothing, our vehicle speeds are matched, but what we can see here is that in the reference lap, the driver is now at full throttle. |
| 46:21 | On the other hand in our, sorry that's our overlay lap. |
| 46:25 | On the other hand in our reference lap, we haven't been able to get all the way to full throttle until this particular point here, 3437 metres which is about 36 metres later up the track. |
| 46:38 | So that's why we can then see that there is this variance, the variance drops away there because the car's corner exit has been compromised. |
| 46:47 | So when we are looking at this variance, it is really important, you're going to see quite a lot of these peaks and troughs and that's not necessarily showing that there was an improvement when I see that, basically when we analyse a little bit deeper, what we know is that the driver actually ended up braking too late, tried to carry too much speed through the corner, that showed an improvement on the corner entry but we lost all of that on the corner exit. |
| 47:11 | And really what we're trying to do as well when we're analysing potentials for improvements there in our lap times, generally we're looking at the corners where we've got a slow corner exiting onto a long straight. |
| 47:24 | Those are the key corners on any racetrack because if we get our corner exit right there, on a long straight, we can get to full throttle sooner, we're going to carry our improvement all the way down that entire straight, so that's the key area that we're generally going to want to focus on. |
| 47:42 | So there's a few areas there, just some easy wins. |
| 47:45 | Another way that we can analyse our data is with a GG diagram or a traction circle as it's often called, and I've set one of those up here, so we'll just head across to our GG diagram and this is simply an xy scatter plot that shows the lateral G force versus the longitudinal G force. |
| 48:05 | So let's just, so we don't have so much mess in our data, let's just turn off our overlay lap. |
| 48:13 | So what we've got here on our vertical axis is our longitudinal G force, so basically G force forwards and backwards in the car, braking and accelerating force. |
| 48:23 | You'll note here that our zero is, let's try that again, our zero is, no try pushing the right button and we'll get a nice straight line, there we go. |
| 48:35 | Our zero's through here. |
| 48:37 | So understandably unless we're dealing with a top fuel drag car, it's going to be pretty difficult to generate exceptionally high accelerating G force. |
| 48:46 | So we see that the maximum G force that we've generated here is around about 0.5G, around about half a G, so no big surprise here. |
| 48:55 | On our horizontal axis we've got our lateral G force which is our cornering force. |
| 48:59 | So first of all, just at a glance, we can see that we are generating around about 1.5, maybe 1.6 G laterally. |
| 49:08 | We are generating about 1.8, 1.9 G under heavy braking. |
| 49:14 | So the important thing to understand here from a vehicle dynamics aspect is that we can operate the car at maximum braking force, or we can operate it at maximum cornering force but we can't achieve both at the same time. |
| 49:30 | So in other words what I'm saying here is that any time we want to brake the car and then turn it into a corner, we're going to start by braking in a straight line with maximum braking force. |
| 49:41 | As our speed bleeds away, we're going to be backing off the brake pedal and starting to turn the car and what we want to do is as we want to turn the car and generate lateral G force, we need to reduce our braking force. |
| 49:54 | So what we should see, ideally is a relatively, it sort of looks more like a squished oval than anything but we want to be operating the car right on the edge of this GG diagram. |
| 50:09 | So by analysing this and looking at how closely we're staying to the edge of this diagram, we can see whether the driver's giving anything away. |
| 50:18 | I wouldn't say this is terrible, what we normally see with drivers who sort of can't really balance braking and cornering is we sort of see a bit of a hollow here, so it'll be a bit more like this where we're going to have no samples out in these areas here. |
| 50:36 | And when we see a GG diagram that looks like that, we know that there's some potential being left on the table there and the driver's going to need to start concentrating on trail braking into the corner and starting to turn the car as they're coming off the brake. |
| 50:51 | Got a couple more aspects to talk about here and this is a good time to mention if you've got any questions, please start asking them. |
| 51:00 | I've got a couple more aspects and we'll get into those questions. |
| 51:03 | So I just want to talk here about braking, let me just have a quick look at our brakes. |
| 51:11 | And yep we've got brake information here on our Toyota 86. |
| 51:15 | We've got, this is just deduced from the factory CAN bus in terms of brake pressure. |
| 51:21 | So you'll see, we've got a number here that says 785 kPa, or let's see, 14,900 kPa, it's not a realistic number, it's not actually pressure but it is still a relative number that we can use to analyse the braking force. |
| 51:38 | So again, let's just get our overlay data back up because we can see a lot about how the driver is using the brakes here and that can give us some information about what they should be doing. |
| 51:52 | So let's just have a look at this area here. |
| 51:54 | So what we want to do is obviously when we get onto the brakes we want to get onto the brakes quickly, generate maximum braking force as quickly as we can and then hold that until we've got our speed bled away, obviously then we can start coming off the brake pedal smoothly as we start turning the car. |
| 52:13 | So for example here, what we can see is at this particular section of the track, not 100% sure where we are here, I just clicked on it, we can see that the driver has got on the brakes later, let's actually turn that back to distance. |
| 52:29 | The driver in the reference lap, the solid coloured line, has got on the brakes later, in this case 1565 metres versus 1560 so five metres, bit over a car length later. |
| 52:40 | The other thing you can see though is that the driver, on the reference lap, has generated more braking force. |
| 52:46 | So quite a significant, probably about a 50% increase in braking force compared to the reference lap. |
| 52:53 | So we can analyse where abouts the driver's getting on the brakes, how quickly they're getting on the brakes. |
| 52:58 | This can also be incorporated with the difference between throttle position and brake pedal so how quickly the driver's getting off the throttle and onto the brakes. |
| 53:05 | Obviously any time we're between those two pedals, the car's essentially doing nothing, so we want to minimise that time. |
| 53:11 | The other aspect you'll see as well is if you're dealing with a car where you are manually heal and toeing on the downshift, it's almost impossible, even for professional drivers to maintain maximum braking force while they're rotating their heel across blipping the throttle to match revs. |
| 53:30 | So you'll generally see, that's actually occurred right here, so this is the throttle blip at this point. |
| 53:37 | You can see, it's not a problem in this case because we clutchless downshift here, the ECU does the downshift autoblip as well, so nice and easy there. |
| 53:47 | So you can get a lot of information from the brake pedal, brake pressure information, again if you've got brake pressure sensors for the front circuit and the rear circuit, then you can also see what your brake bias is or what the split is there. |
| 54:02 | Alright the last aspect that I want to talk about here is our section times. |
| 54:10 | So this is another really good way of analysing all of your data. |
| 54:14 | So we've got a section times worksheet, let's go and have a look at that. |
| 54:18 | So this particular track, I've broken up really really simply into just three sectors, sorry four sectors I should say and I'll go through shortly how you actually get, how you normally see this data represented and why I've chosen to break it up into four sectors. |
| 54:38 | So this is all of that data, it's from a race, so we've got 30 laps, there's a lot of information in here. |
| 54:44 | Basically what we're seeing is any of these blue sectors here, these are our fastest sectors, so for sector one, lap 15 was where we ended up with our fastest sector, for lap 21 that gave us our fastest sector two, and then if we move across here we've got our three and four were on our lap 30. |
| 55:11 | So what it's shown us here is our totals for lap 30, 1:45.284. |
| 55:17 | Now there is a little bit more information there shown to the right. |
| 55:21 | So first of all we've got, I'm going to skip our eclectic, we'll talk about that next. |
| 55:26 | We've got our rolling minimum. |
| 55:28 | So this is the fastest consecutive sectors but not necessarily across the start/finish line. |
| 55:34 | So let's say you're on an absolute scorcher of a lap, you get to the last corner before the start/finish line and you catch a slow car and basically have to compromise your line, it throws away your total lap time. |
| 55:47 | However if your lap prior, you had also been fast in the last section of that lap, the rolling lap time basically shows the fastest combined sectors that you drove consecutively, so it's a real lap time that you actually achieved however it's not necessarily across the start/finish line. |
| 56:08 | So you can get some bragging rights but probably no one's really going to care. |
| 56:12 | The other aspect of looking at this data is the eclectic time. |
| 56:16 | And this can be something that is potentially a little bit misleading. |
| 56:21 | So we need to be a little bit careful with eclectic time. |
| 56:24 | So eclectic time simply looks at each of the sectors on the track and gives you the fastest combined sectors. |
| 56:31 | So in general, what you'd like to think is that this is your, let's say theoretical fastest lap time. |
| 56:39 | The reality is though, you do need to be a little bit careful about analysing the eclectic times because it's really easy to end up making a mistake in one sector that then gives you a faster sector time. |
| 56:52 | So let's say we just completely out brake ourselves one sector and you get an absolute scorching time for that particular sector but it's not very realistic because by out braking yourself, you've thrown away the next sector, there's no way of getting through the next corner. |
| 57:07 | So sometimes that information can be pretty misleading. |
| 57:10 | And the way the eclectic time works is that generally if you've got more sectors to your track, you're going to end up with a bigger variation in your eclectic time. |
| 57:21 | So it's quite important to not go overboard with how you break your track down. |
| 57:27 | Generally the good rule of thumb is to use somewhere between about five and seven sectors, and quite often particularly with a MoTeC here, the way this will work is if I generate my track, it's going to break up ever corner and every straight and that's going to give us a lot of sectors for our track. |
| 57:44 | So we're going to end up potentially with a really really unrealistic eclectic time. |
| 57:48 | So 1:44.915 there, let's just have a look at how that works. |
| 57:54 | So let's go to our track editor. |
| 57:58 | So here we've got our four sectors. |
| 58:01 | What we'll do is just delete these and we will generate them again, we'll generate some sectors with, basically what we can do here is enter a turn threshold factor, basically this will just, the way we enter this number will define how much of a curvature the track needs for the i2 to basically conclude that that is a corner, so let's just start with 50%, the default. |
| 58:32 | And so straight away you can see now we've got a lot more sectors added in there. |
| 58:36 | So if we go down there we can see huge amount more. |
| 58:40 | Let's just add all that in. |
| 58:43 | So this is a perfect example of what I was saying, so our eclectic time now has come down to a 1:41.39. |
| 58:53 | Remembering that the actual lap that we drove was a 1:45.284. |
| 58:57 | So we're essentially four seconds faster on the eclectic time. |
| 59:03 | And I can guarantee you that there is no way that it would be possible to drive a 1:41.3 with this particular car around the track. |
| 59:10 | So it's not realistic and it can be quite misleading. |
| 59:12 | Provided you've got a realistic number of sectors, somewhere between perhaps three and seven, the other good tip here is to make sure that your sectors start in the middle of a straight, rather than on a corner, your eclectic time's going to be a lot more sensitive to having the sector start or finish in the middle of a corner, on the apex of a corner than in the middle of a straight. |
| 59:35 | You should find that a good driver will be able to get within perhaps about a 10th of a second of their eclectic time and that means that you're doing a pretty good job compared to what's actually possible with that particular car. |
| 59:48 | Alright, let's get into some questions, and if you do have any more, please feel free to ask them, we'll see how many of these we can get through. |
| 01:00:03 | Kevin has asked, what would be the advantages of purchasing a digital dash display with a logger versus using a tablet and a CAN bus bluetooth adaptor? Actually Kevin, that's a good point, it's something I probably should have covered off here because I know that this is getting a lot more popular. |
| 01:00:21 | The tablet style logger is not something I've personally used. |
| 01:00:29 | So on this basis, I'm not in a position to give a lot of comparative feedback. |
| 01:00:34 | Essentially as long as you can get the information into the tablet at a decent rate, then there should be no reason why you can't use that. |
| 01:00:43 | The important aspect here is what are you actually generating out of the end of this and how can you analyse it? As long as it can produce a .CSV file which just about any data logger can do, you might not be able to analyse that in MoTeC's i2 which has obviously been the focus of today's webinar, but there are other packages like MegaLogViewer HD which will be able to analyse them. |
| 01:01:06 | So that can actually work out to be a cheap, effective option. |
| 01:01:09 | Now I just mentioned there about data logging rates as well, it's really important when you are looking at all of this information to make sure that you can get the data at a high enough rate. |
| 01:01:21 | So what I'm talking about here is how often the particular channel is updated and logged. |
| 01:01:26 | So for a fast moving signal like wheel speed, generally we're going to want to be at least 20 if not 50 times a second, 50 samples a second. |
| 01:01:35 | In some signals, particularly if we're looking at analysing something like the operation of a paddle shifted gearbox, some of those signals we're looking at 200 or even 500 times a second. |
| 01:01:47 | So whether or not the tablet system is able to do that is something that I'd just want to be fairly sure of. |
| 01:01:57 | Kelvin has asked, are there any clear advantages to matching the brand of dash logger to the brand of standalone ECU already in the car? These days, honestly it really doesn't matter. |
| 01:02:07 | Now that CAN is so common you can just about get CAN data streams into any system. |
| 01:02:14 | Obviously every system has their own pros and cons, their own advantages and their own price point so it's really just a case of making sure that the system that you're looking at is capable of giving you the data that you want to see and in a format that you need to see it in, making sure obviously that that matches your budget. |
| 01:02:33 | What I will mention is that some of these dash loggers are a lot more configurable than others in terms of CAN data. |
| 01:02:40 | So for example here, most of the common dash logger units will have CAN templates already set up for most of the mainstream ECUs. |
| 01:02:50 | So let's say for example you've got an AEM dash unit and you want to get data out of a Haltech ECU, well there will be a template inside of the AEM dash that allows it to take that CAN data stream and then display RPM, wheel speeds et cetera. |
| 01:03:07 | So really for the end user, pretty simple. |
| 01:03:09 | When you're starting to get into doing some of the more advanced functions though, you can get stuck or limited with some dashes if the CAN data stream is not end user configurable so you can't essentially write your own CAN template for a particular sensor that you've purchased. |
| 01:03:28 | Blackrex has asked, is that Ben's data that we're looking at? I can neither confirm nor deny there Steven. |
| 01:03:36 | We've got a couple of questions here, Raise the roof, instead of distance, should I compare GPS position, you can take different lines, thereby changing the length of the track and just as time will give you inaccuracies, so will wheel distance. |
| 01:03:49 | Yeah OK so, and Kelvin has asked, wouldn't comparing GPS position instead of distance travelled be a better reference considering the lines the driver takes can make variations in distance travelled? OK so yeah some fair questions there, there are some things that we do need to sort of be aware of there. |
| 01:04:07 | There aren't a lot of absolutes here so that's important to mention and yes if you take an unusual driving line, that's going to add to your distance. |
| 01:04:15 | However that's important because you are actually driving that distance. |
| 01:04:19 | GPS on the other hand, there are some inaccuracies in the GPS location as well so that's not an absolute either. |
| 01:04:26 | In terms of wheel speed giving you inaccuracies in terms of wheel spin or lock up, systems like MoTeC's i2 can actually account for that. |
| 01:04:36 | Essentially if the wheel speed drops to zero, but the G force doesn't demonstrate that the car's come to a stop, then the system can actually infer that lock up has occurred and account for that, so basically there isn't a perfect solution here. |
| 01:04:54 | For the home enthusiast though, the GPS does an admirable job and it's more than within the realms of what we need in order to actually improve our driving. |
| 01:05:06 | Figar has asked, how do we calculate suspension data to suspension setup? OK that's a little bit more advanced than what we're talking about here today. |
| 01:05:15 | We will probably get into some more advanced setup at a later point in terms of suspension, damper position, logging et cetera. |
| 01:05:26 | We've actually done this on one of our other cars and I definitely wouldn't say at this point that I'm an expert on it. |
| 01:05:31 | We had a set of relatively cheap BC Racing external reservoir coil overs in our other Toyota 86 development car. |
| 01:05:38 | That particular damper has an external reservoir which means we've got independent bump and rebound adjustment. |
| 01:05:44 | We fitted a shock travel potentiometer onto the dampers and basically logged that data at 500 hertz into a MoTeC CDL3 dash. |
| 01:05:54 | And using i2, basically it can take the damper position, turn that into damper velocity and the produce what's called a shock velocity histogram. |
| 01:06:04 | And essentially that'll show you a histogram of the shock velocities, you can then adjust your bump and rebound adjustments. |
| 01:06:12 | The idea there is you're basically trying to get what looks like a normal distribution curve or a bell curve. |
| 01:06:18 | And over the course of about, I think it was about eight or 10 laps of making adjustments, I found out first of all with the BC Racing coil overs, there was almost no change in the adjustment for bump and rebound damping over the first 10 or so clicks. |
| 01:06:33 | So from going from full soft, 10 clicks harder, out of a complete adjustment of 30, I think it's 30 or 32 clicks, the first 10 clicks gave me absolutely no difference. |
| 01:06:42 | Once I actually got into the point where we were starting to see some adjustment though, it took about another four sets of adjustment before I'd managed to even out the bump and rebound side of the shock velocity histograms. |
| 01:06:55 | Now all I was doing there was making an adjustment, looking at the data, making and adjustment, going out doing a warmup lap, flying lap and then coming back in to do the same. |
| 01:07:04 | And so I was pretty consistent with the driving and over that course of adjustments, I dropped about 8/10ths of a second. |
| 01:07:10 | So very powerful and as I say, we need to get a little bit more into that before we can really do some justice to presenting a webinar on it. |
| 01:07:23 | Raise the roof has asked, what data rate are we talking on this logging system and are all the channels logged at the same rate? OK so data rate is really going to be dependent on the logging system that you're dealing with and the data that you are looking at. |
| 01:07:37 | So no they are not all logged at the same rate, there's no need to do that. |
| 01:07:41 | So for example, if we're looking at a relatively slow moving channel such as engine coolant temperature, oil temperature, air temperature, generally I'd be logging those at about two samples a second. |
| 01:07:52 | So they just don't change that quickly. |
| 01:07:55 | However something like throttle position, manifold pressure, engine RPM, wheel speeds, these do change reasonably quickly so generally I'd want to be looking at those at least 25 to 50 hertz. |
| 01:08:07 | In some systems we may be wanting to, we may go even higher than that. |
| 01:08:10 | The more samples per second we look at though, the quicker you're also going to fill up your logging memory. |
| 01:08:16 | So 50 hertz is probably going to be more than adequate for most purposes. |
| 01:08:21 | As I mentioned just before, there will be some specific setup jobs such as setting up paddle shift for example where we really would like to look at these samples much much faster, 200 to 500 hertz is not uncommon. |
| 01:08:37 | Skirt boy has asked, is a GPS with an integrated IMU with a gyro system worth the added cost? Looking at the VectorNav system. |
| 01:08:49 | At this point, I can't answer that question because we haven't had the benefit of having one. |
| 01:08:53 | We are about to fit a Syvecs IMU into our Toyota 86 racecar. |
| 01:08:59 | Quite interested in looking at the data and seeing what that can tell us. |
| 01:09:03 | I would say for probably 95% of people, completely superfluous to your data analysis package and again it comes back to what I was saying, often with data analysis, less is more. |
| 01:09:18 | Don't over complicate things, you can do so much and get so many gains with just a basic set of inputs and then once you're really confident with data analysis in general and you're starting to chase after those small incremental gains, particularly with an IMU, this would be more around chassis setup as well, then yeah that may make sense but it's not the first sensor that I would be reaching for. |
| 01:09:43 | Alright, that's brought us to the end of our webinar. |
| 01:09:45 | As usual, if you do have any questions that come up after this has aired, please ask them in our forum and I'll be happy to answer them there. |
| 01:09:53 | Thanks for joining us and look forward to seeing you all next time. |