236 | Drag racing Data analysis
Summary
A pass down the drag strip can be over in just a few seconds and data logging is vital in order to be able to analyse and understand what happened and how to improve the car for the next pass. In this webinar we’ll discuss what you should be logging and how best to analyse this data in order to make sense of what you’re seeing, as well as how to decide how much power you can put to the drag strip.
| 00:00 | - Hey guys it's Andre from High Performance Academy, welcome along to another webinar and this time we're going to be looking at how we can use a data analysis package in order to help improve our times at the drag strip. |
| 00:12 | Now we've talked in the past, there are a few webinars in our archive about using data analysis for circuit racing but the data analysis system is just as important to optimising the performance of a drag car and there are of course a few different ways that we'd go about using data analysis for that particular purpose. |
| 00:32 | That's what we're going to dive into during today's lesson and as usual, if you do have any questions, please feel free to ask those and I'll get into those at the end of the lesson. |
| 00:44 | Now what we're going to do is just jump across to my laptop screen for a moment and the car that we're going to be looking at some of the data from today is one that we built for one of our customers. |
| 00:54 | This was affectionately referred to as Project DS9. |
| 00:57 | The aim with this car was to break the late model Evo four wheel drive world record which at the time was set at a 7.42 by AMS Performance in the United States. |
| 01:09 | Now over the course of about three seasons we developed this car, at the time it was retired it had done exactly what we set out to do, it held a new world record with an 8.34 at 169.7 mph. |
| 01:22 | Of course these days that record has dropped significantly, there are a number of cars in the seven second zone now and of course that's the thing about world records, someone's always going to come and beat it but we're really proud of first of all setting that record, and even after this car was retired, it held that record for a number of years. |
| 01:43 | There is no way we would have been able to dial this car in though and get it to do what we wanted it to do without the aid of a pretty comprehensive data analysis package so that we could see exactly what was going on out on the drag strip after each run. |
| 01:59 | The problem is, particularly with these faster cars, once you're starting to talk about eight second passes or obviously the faster you go the more important it becomes, seven, six, five second passes. |
| 02:09 | There's a huge amount of things going on in a very very short period of time and it's impossible sometimes for the driver to completely recall everything that went on down the drag strip and of course we want to also monitor the engine performance and we want to do this sometimes at very high sampling rates as well so we can see exactly what was going on. |
| 02:28 | This is where the datalogger really comes in, it doesn't lie and knows exactly what happened and it doesn't forget so using a quality datalogger is going to be the key to better elapsed times. |
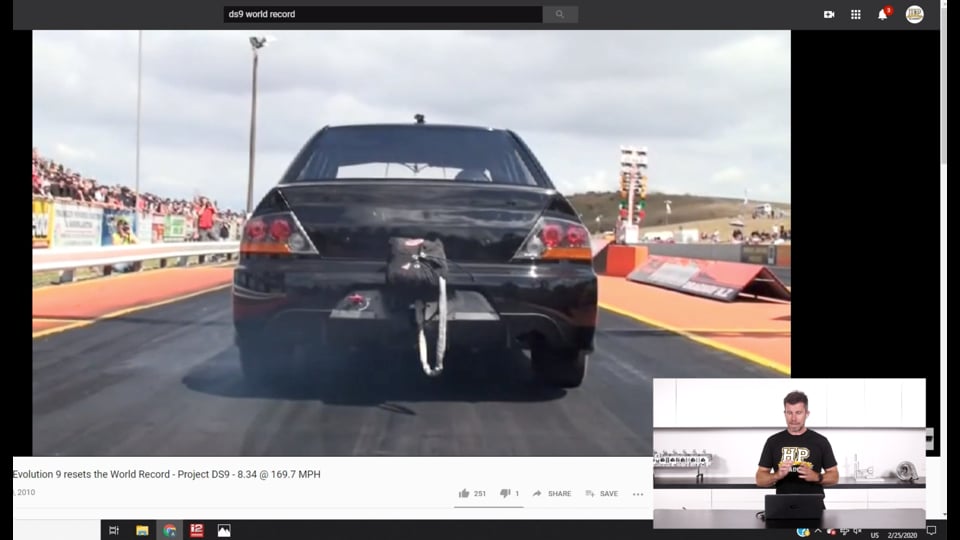
| 02:43 | Now before we jump into a little bit more about data analysis I think just to get some perspective on this particular car, we're going to head across to my laptop screen and we're just going to watch a short video. |
| 02:53 | Please bear with me and forgive me for the quality, this was shot back a number of years ago, 2010 to be exact and the quality, particularly of the in car, is terrible. |
| 03:04 | I assure you, it was not shot on a potato, even if it does look like it. |
| 03:08 | So this is the car actually setting its world record, 8.34, 169.7 mph. |
| 03:13 | We've got a couple of angles here, here's the in car as well. |
| 03:16 | This car uses what we called a ghost shifter so it's a push button pneumatic shifter, so you'll see once the driver leaves the line, both hands stay on the steering wheel and you can see there as well, particularly in first gear the thing is pretty brutal so being able to control the car with both hands on the wheels is quite important. |
| 03:34 | And also just there, I'll just go back a little bit, because we had compressed air on board, we also used that to function the release for the parachute. |
| 03:44 | So this is something that most faster cars will have is one or two parachutes on the rear to help them slow down and of course that requires you in the deep end, when you're going as fast as you're ever going to go to actually take one hand off the wheel and release the parachute manually. |
| 03:58 | So using this, as you can see, I'll just play it again here, we just used another air ram and that just actuates off another button on the steering wheel, again allowing the driver to retain control. |
| 04:09 | Third and final angle here, obviously from the back and the other thing to note here which is a little bit awkward, the car in the other lane that's just about to come into shot here is actually another car that I was tuning at the time, that's the Heat Treatments Racing R32 GTR. |
| 04:25 | Hasn't been doing much lately but at the time I was involved with that car it held the world record for the fastest four wheel drive outright. |
| 04:34 | I think off the top of my head that was running in the 7.40, 7.50 vicinity. |
| 04:39 | Now again, time's moved on and there are four wheel drives well into the sixes but again that's what happens with technology. |
| 04:45 | So there you go, that's what it kind of looks like inside of the car and again obviously there's much faster cars than an 8.3 second car but even at that sort of elapsed time, it's really really difficult for the driver to come back and know exactly what happened, where abouts did the car perhaps have too much power, where was it wheel spinning and what needs to be done in order to make it better? And we'll just jump across to my laptop screen, this car had more power than it could put to the track, except for in fourth gear so getting it to launch consistently was a real struggle and that's kind of what it looks like when you get a little over enthusiastic with power delivery and put too much boost and too much power through first gear. |
| 05:34 | Makes for a fairly wild ride from the driver's perspective, beats up on a lot of equipment that you don't really need to be beating up on and of course the end result of this is a sub par ET at the end of the strip anyway so it's all about matching the engine performance and the engine power delivery to the amount of traction available. |
| 05:54 | Alright so what we're going to do is start by talking about the options available for your logging. |
| 06:00 | And there are multiple different systems available. |
| 06:04 | What we'll find is that almost any aftermarket standalone ECU that you're going to be using these days is going to have onboard logging. |
| 06:11 | And this can be a really sensible option because it's obviously already there, you've already got the ECU in there running the car so it can make sense. |
| 06:20 | Also, all of the engine data is already understandably going to be processed by the engine control computer so all of that's there, our RPM our throttle positions, manifold pressure, EGTs if we're monitoring those, et cetera, everything's there, all of the health information that we need to know about from the engine. |
| 06:39 | What we may be missing though which does need some consideration is some of the chassis related data and how far you're going to go with this is really dependent on what you're trying to achieve and definitely down to your budget as well. |
| 06:51 | At a minimum it would be nice to have wheel speed, in a four wheel drive car like this we're running essentially a locked four wheel drive transmission so all four wheels are essentially forced to run at the same speed so there's no need to go to the trouble of having four individual wheel speed sensors on it. |
| 07:10 | For this particular car we're really interested in optimising the launch and getting the 60 foot as sharp as we could get it. |
| 07:17 | And part of that was we fitted shock travel potentiometers on the car so what this allowed us to do was see how much the car was squatting on the initial hit when the driver lets go of the clutch and this way we could then set the car up when we were doing the wheel alignment with the front raised and the rear squatted to the right place and this was we could optimise our camber and our toe, and particularly our camber there so that we weren't getting any negaitve camber, we're getting as much of the tyre contacting the racetrack at the point where the car needed that traction the most. |
| 07:52 | So a few little tricks there so basically that's one option, as long as we can feed that information into the ECU from the chassis. |
| 07:59 | The other option which is becoming increasingly popular is to use something like a dash logger. |
| 08:06 | This particular one here that I've got is an Ecumaster ADU 7. |
| 08:10 | The particular car that we're talking about today, DS9 was fitted with a MoTeC SDL 3, SDL 3 I think it was, it's a little bit long ago now for me to specifically remember. |
| 08:21 | Obviously these dash loggers are available from a range of different manufacturers. |
| 08:25 | Now this can actually make a lot of sense. |
| 08:28 | So obviously going to be spending a little bit more money on one of these units. |
| 08:31 | But the advantage is that it does then allow you to program in driver warnings. |
| 08:37 | Obviously with a highly stressed engine, you've got a fairly narrow window in order to make sure that everything is going how it should be and if we wait 'til the driver actually notices that the engine is doing something wrong, maybe misfiring or maybe starts to fall off on power. |
| 08:53 | It's quite often going to be too late and you're going to end up with significant damage to the engine. |
| 08:58 | So by monitoring all the engine vitals, let's say fuel pressure and oil pressure, then what we can do is bring the driver's attention to a warning on the dash if something goes outside of the normal operating bounds. |
| 09:09 | I also quite often will incorporate exhaust gas temperature sensor data on the dash so if one of the EGT sensors spikes too high, that'll bring on a warning for the driver. |
| 09:21 | So under normal circumstances the driver will solely be paying attention to the shift light module across the top but if something does go out of bounds then they can read up on the dash as to what exactly that is. |
| 09:35 | And I'll just mention here as well, while it's a little bit outside of today's topic, having the shift light module is really really important to give the driver a good reference of when to shift gear. |
| 09:46 | Particularly with these multi LED shift light modules, you can bring those LEDs on in stages, it's all personal preference. |
| 09:53 | These days what I do with our circuit cars is I'll start on the outside and as the RPM increases we'll progressively light the LEDs towards the inside. |
| 10:02 | So the driver can start to pre empt what RPM or when exactly to shift. |
| 10:07 | Obviously particularly in the lower gears, the car is accelerating much more quickly, most of these dashes will also allow you to stagger the shift light. |
| 10:15 | So for example if you've got a shift point of 10,000 RPM, in first gear with the driver reaction time, you might have to bring that shift light on at maybe 9700 RPM just for argument's sake. |
| 10:30 | In second, third and fourth gear, obviously the car starts to accelerate slower and slower so maybe in third gear, on third to fourth shift, you can bring that shift light on at 9900 or 9950 RPM and by looking at the data, seeing where the driver's shifting, you can start manipulating those shift points until you're seeing consistent RPM on the shift point inside of the data. |
| 10:52 | So getting data into one of those dashes, generally it's pretty easy, you can wire sensors directly into most dashes. |
| 11:00 | Obviously you want to make sure that the specs allow sufficient inputs to match what you're trying to do. |
| 11:05 | Nice facility these days is that almost all of these aftermarket dashes and ECUs can talk together via CAN so you don't necessarily have to have a MoTeC dash and a MoTeC ECU, you could run a MoTeC dash with an Ecumaster ECU or a Haltech or whatever and vice versa and just select the correct template. |
| 11:25 | So this gives you a nice place to do central logging, most of these dashes also include a three axis G sensor whereas we don't see that in all aftermarket ECUs so that might mean that you can then log longitudinal G force which is quite important to look at, without the need for adding an additional sensor. |
| 11:47 | The third and final option which I'll mention but these days probably isn't that critical or that common, would be to use a enclosed logging module, a separate logger like a little black box that we can fit somewhere in the car. |
| 12:02 | These enclosed loggers generally don't have a driver display but they can also use a satellite display, MoTeC for example offer their ACL logger, advanced central logger I think that stands for. |
| 12:16 | And that can then obviously display information on one of their MoTeC dash loggers as well. |
| 12:22 | There are some advantages at the high end with some of these enclosed loggers in that they can usually log a huge amount of data, not particularly useful for an eight second drag pass, often they can also incorporate data from a wide range of sensors, a lot of inputs, and they can often log at higher sampling rates than what a lot of dash loggers or ECUs can. |
| 12:45 | So those are the three main options. |
| 12:47 | Generally ECU is going to be the key one. |
| 12:50 | Dash logger if you've got a little bit more money is a nice second option there to have as well. |
| 12:57 | Now that we know what our options are for logging, we're also going to talk about what we are going to be logging, what information do we want to actually log. |
| 13:05 | And generally we can break this down into three areas, we're either going to be looking at our engine operation, we're going to be looking at the chassis and then we're going to be looking at the driver. |
| 13:16 | And particularly when we're just getting started, if you haven't got a lot of budget for sensors, we're really going to be focusing more on the engine and the driver. |
| 13:24 | Let's talk about the engine for a start because it doesn't really matter how much power your engine is producing or how much grip is available on the track, if the engine has a problem and it's about to grenade into a million pieces on the very next pass, you really want to find that out before heading back out onto the drag strip for another crack. |
| 13:45 | So it's always important to start by just analysing the engine performance and what I'm talking about here is the key engine vitals. |
| 13:52 | Was our air/fuel ratio on track, was our boost where we wanted it to be, what RPM was the driver shifting at, are there any problems there? Was our engine coolant temperature, our inlet air temperature under control and where we need them to be? If we've got exhaust gas temperature, we also want to see if there was any problems with the peak exhaust gas temperature on any of our cylinders. |
| 14:14 | Particularly if you've got an issue with, pre ignition is a big one, particularly on methanol powered drag cars or ethanol powered drag cars, what we can get is pre ignition occurring, even though those fuels are much more resistant to detonation, they are actually more prone to pre ignition than a gasoline based fuel. |
| 14:34 | So what we'll see, and we've lost an engine to this in the past is that the EGT will start to skyrocket before the end of the drag strip, and I'm just going to see, while I'm talking here, if I have exhibit A here to show you, and I do. |
| 14:50 | This is a piston that was damaged from pre ignition. |
| 14:54 | We'll just head this under our overhead camera. |
| 14:57 | So with pre ignition, some of the damage can look very similar to detonation. |
| 15:01 | Often they are confused. |
| 15:04 | One of the keys is that pre ignition happens very quickly and it's much more destructive in a short period of time. |
| 15:10 | We'll also see, while it might be a little tricky to see on our overhead camera here, pre ignition causes a huge amount of heat, particularly into the crown of the piston and we can actually see here there's an indentation, so the piston crown has begun to melt and obviously it's ended up resulting in the side being lanced out of the piston there. |
| 15:27 | So while in this case it didn't save our engine, we knew from the data what was going on. |
| 15:34 | In this case there was no ability to bring on a driver warning for EGT but that can be something that's quite useful to monitor. |
| 15:44 | Particularly if you're just starting to see one cylinder creep away then that's a potential red flag that something's not right. |
| 15:53 | Another aspect with the EGT sensors which is actually quite useful is in high boost turbo applications, then you're likely to find that your engine can suffer from ignition misfires. |
| 16:06 | This is one of the things we do tend to chase. |
| 16:08 | While the EGT sensors are a little bit slower to respond than the likes of a lambda sensor, quite often we will see a misfire represented as a cylinder that goes cold. |
| 16:19 | So this saves time because you don't have to go and waste another couple of runs down the drag strip, swapping ignition coils or plugs, you can go straight to the cylinder that you know has the problem, replace the components on that cylinder, maybe do a compression leakdown test just to make sure that mechanically everything's OK and then you can be confident when you head back onto the strip that your problem is solved. |
| 16:41 | When we're looking at our engine health, those are the sort of key things we're looking at. |
| 16:46 | Is our fuel pressure and our oil pressure OK, are our EGTs OK, have we got any issues with our fuel pressure and in turn is our lambda, our air/fuel ratio on track? If all of that checks out then we can basically be pretty certain that the engine is going to be healthy, it's going to survive another pass and we can move onto the other aspects. |
| 17:09 | Of course in line with this, is our engine power so our torque delivery and we're going to also be focusing on optimising that. |
| 17:17 | So this comes down to basically looking at where the car is suffering from traction issues, maybe pulling some power out of the car in those particular instances. |
| 17:28 | So we're going to have a look at a few examples of that shortly. |
| 17:31 | In fact what we'll do is we'll just head across to my laptop screen for a moment here. |
| 17:37 | And this particular run is the Project DS9 world record pass and the one aspect I just wanted to show you here in terms of power delivery, in our third graph down in blue we have our boost pressure, our manifold pressure in kPa and this is a four speed gearbox so we can see that this is first gear here, we've got a shift where it drops away, second gear, again a shift, third gear here and of course in the end, fourth gear. |
| 18:06 | Now what we can see here is if we look at the peak boost in first gear, right at the end just before the shift into second we can see that's peaking at 324 kPa, so this is absolute. |
| 18:17 | So 224 kPa of positive boost pressure, so 2.2 bar. |
| 18:22 | Then we step up here to 2.5 bar in second gear, in third gear 2.8 bar and then finally our peak boost value here, 3.1 bar. |
| 18:34 | So just a touch over three bar, it actually drops away a little bit here at the top of fourth gear. |
| 18:40 | Now when we're looking at this, the boost pressure we can see, what I'm doing is manipulating the boost pressure as the car goes down the track, we go through the gears, the torque multiplication through the gearbox drops away so we're not putting as much torque to the axles and also at higher speeds we can put more torque to the road anyway. |
| 18:59 | So what we're trying to do is basically optimise the power delivery, the boost pressure as we go through the gears, that's the easy way to do it in a turbocharged car. |
| 19:08 | Even given that, we can see here in third gear, if we look at our RPM trace right at this point here, we can see that the car has broken into wheel spin. |
| 19:16 | So this comes down to just knowing how to analyse what our data trace is trying to show us, let's just pull that RPM trace down and make it a little bit bigger. |
| 19:25 | Throttle position here in green, pretty boring, you can see that's just staying at 100% the whole way through. |
| 19:31 | So you can see there, we've got this little spike of wheel spin and this has probably been quite manageable and all things. |
| 19:39 | What we can find is if we really overcook it and we put too much boost in there, once the wheels actually start to spin, we need to generally reduce the power in order to bring traction back. |
| 19:50 | So this might require the driver to actually pedal or get off the throttle and get back on it, again that destroys your time. |
| 19:56 | This is actually an aspect of the racetrack that the car was running at, this is a drag strip called Meremere which is based out of Auckland in the North Island of New Zealand. |
| 20:07 | And unfortuantely it was built essentially on swamp land several decades ago and over time what happened is that the drag strip surface actually moved around a little bit and we have this situation where there's a very slight hump in the middle of the track. |
| 20:23 | This is what we've run over here in third gear. |
| 20:25 | As the car goes over the hump and gets a little bit light, that's enough just to allow it to wheel spin but of course as it comes back off the hump, it settles back down and it grips back up. |
| 20:34 | We can also see that we've got a little bit of trouble here with some very very light wheel spin in fourth gear but again nothing really to be too concerned about. |
| 20:42 | Alright so that's the sort of stuff we're looking at when we're trying to optimise the power delivery. |
| 20:47 | We'll talk about a couple of other techniques we can use for power delivery and torque control in a few moments. |
| 20:55 | Moving on, we also need to understand the chassis operation. |
| 21:01 | Now this is something that probably initially we're not going to have. |
| 21:05 | As I mentioned, it's nice to have, not have a lot of data here I should say. |
| 21:09 | As I mentioned, it's nice to have at least wheel speed so we can actually see what's happening. |
| 21:14 | The wheel speed obviously works in conjunction with our engine RPM. |
| 21:17 | So that's going to be another indicator that we have wheel spin. |
| 21:21 | In a two wheel drive drag car we can use a driven and undriven wheel speed and that can help us look at wheel spin as well and we can actually create a math channel that will show us how much wheel spin we've got. |
| 21:34 | Really useful for analysing the launch parameters as well. |
| 21:38 | And then of course there's the other more sophisticated aspects that I mentioned such as having shock travel potentiometers so that we can actually see how the car is squatting, allowing us to optimise the wheel alignment on the launch. |
| 21:51 | If you want to get carried away here as well, if you've got a set of suspension that has adjustable bump and rebound dampening, by logging the shock travel potentiometers, you can create a shock velocity histogram that can help you with tuning your bump and rebound settings but that's probably a little bit sophisticated for today's webinar. |
| 22:14 | The next aspect is looking at how the driver is responding or how well the driver is doing. |
| 22:21 | So again if we can head back to my laptop screen for a moment. |
| 22:25 | One of the parameters that we're going to be looking at is what's the driver doing on the throttle and again this is a pretty boring example because obviously the car is for the most part hooked up so the driver is just staying at full throttle there. |
| 22:36 | What we'll do is we'll just have a quick look at another piece of data here, no not that one. |
| 22:46 | Somewhere here we have one which is horrible. |
| 22:50 | So this is from the Heat Treatments R32 GTR and you can see the driver's had a massive pedal as the car came off the line right here. |
| 23:00 | The car has just lit up and gone straight into wheel spin so we can see from the RPM trace the RPM is basically sitting right up here bouncing on the rev limiter at about 9500, 9600 RPM. |
| 23:12 | And the driver's kind of stayed in it for a little bit and then finally gone hey you know what, this isn't really working that well for me, he's probably facing the wall at 90 degrees at this point, so decided it was in his best interest to abort, get out of the throttle and get back into it. |
| 23:26 | So this again can be used in conjunction with our, detecting wheel spin, our RPM trace, our wheel speed traces, to decide what's going on, are we putting too much power into the chassis, and that can be the final factor is that the driver has to get out of the throttle. |
| 23:42 | The other aspect to look at is how consistently the driver is shifting gears. |
| 23:48 | Now I've already mentioned that briefly so we can see this isn't a bad example, I think we're 9988 RPM, probably was a 10,000 RPM shift point. |
| 23:59 | First gear, which is a little bit harder to judge because of wheel spin, you can see it's actually short shifted here a bit at about 9400 RPM. |
| 24:06 | Third into fourth gear though, pretty much again short shifted, 9750 RPM. |
| 24:13 | So based on this we can see what the driver's reaction time is and as I mentioned we can choose to manipulate the shift light points. |
| 24:20 | One of the reasons we want to be able to do this is particularly with a large turbo on a small capacity engine, we're going to have the turbo drop off boost. |
| 24:29 | So I find that we can keep the RPM right at the peak in our power band and then that helps reduce the amount the turbo's going to fall off boost. |
| 24:39 | Obviously this needs to be considered if our peak power happens at 8500 RPM, then we're not going to want to run the engine all the way out to 10,000, that makes no sense. |
| 24:49 | It's all about useful powerband. |
| 24:51 | Generally I'll try and run an engine maybe around about 500 RPM beyond the point on the dyno where it's making peak power and generally we're going to have a gradual drop away in our power. |
| 25:02 | There's some more sophisticated ways of deciding what your correct shift point is as well, mapping the torque versus your gear ratios, again a little bit beyond the scope of our webinar here today. |
| 25:15 | But more to the point, we can see exactly what the driver is doing on the controls. |
| 25:19 | In this case the throttle and the shifting. |
| 25:22 | If you're getting a little bit more sophisticated as well, you can notice what they're doing with the steering, you can have steering wheel angle sensors but again, not really much use for the entry level and certainly if there is sufficient reason for the driver to be turning the wheel as they go down the strip, you've probably got too much power going into the car anyway and that's going to show up as wheel spin. |
| 25:48 | Alright so there's the key aspects we are going to be needing to consider. |
| 25:53 | Now we're going to get onto what we're actually analysing inside of our data as we go through this. |
| 26:00 | And as I said, we're really going to start always by making sure our engine is healthy, everything is where we want it to be there. |
| 26:09 | So let's have a quick look back at this data here. |
| 26:11 | So the first thing I would look at, actually let me just get our other datalog loaded up. |
| 26:17 | That one there. |
| 26:22 | Just make sure I actually have the right data. |
| 26:25 | OK we'll have a quick look at some of the aspects here, no that's not the right one. |
| 26:30 | I need that one. |
| 26:33 | Alright so this actually hasn't been set up into a drag run which I'll talk about shortly, but what we want to do is have a look at what we've got going on here. |
| 26:43 | So first of all, we want to have a look at our RPM and a nice function here in the MoTeC software, I'll mention here we are using MoTeC's i2 software for today's demonstration but most of what we're going to be talking about will work in every other software analysis package, it's just the hot keys or the naming criteria might be slightly different. |
| 27:03 | Here in MoTeC, if we press the M key, this will give us over on the right hand side, the minimum, the maximum and the average during the portion that is on the screen. |
| 27:14 | So this is linked or zoom linked they call it, so as we move around the log file, it will change. |
| 27:21 | So straight away from this we can see that our minimum RPM before the driver bought the RPM up was 1590, maximum was 9798, don't really care about the average here. |
| 27:34 | Next we want to also have a look at our boost pressure and make sure that was doing what we'd expect. |
| 27:40 | So let's just get our trace looking a little bit bigger here. |
| 27:43 | We've actually got two pieces of information overlaid here. |
| 27:45 | We've got manifold pressure which is our inlet manifold pressure, or our boost pressure. |
| 27:49 | We've also got exhaust pressure which is a slightly useless piece of data in this case and I'll talk about why that is the case a little bit later on. |
| 27:57 | But what we can see here is at the point where the driver has dropped the two step, the boost pressure's sitting at about 42 psi, give or take and then as the car's gone down the track, the boost pressure has increased and we've ended up with 57, 58 psi in the deep end there. |
| 28:17 | So boost pressure in this case is under control, it's done what we want, we've obviously got our throttle position, not too worried about that for this particular case. |
| 28:25 | And we want to also have a look at our air/fuel ratio data. |
| 28:28 | So in this case we're displaying this in units of lambda. |
| 28:31 | We've got a fairly flat trace here, we've got a little bit of a spike here when the car is on the two step. |
| 28:37 | Using an ignition cut you're going to always have unburned fuel and air going through the combustion chamber so the result of this is that the trace can look quite spiky, that's not necessarily anything to worry about. |
| 28:48 | Likewise if you are using a manual gearbox, which uses an ignition cut, you're going to see a lean spike on each gearshift and again that's nothing to get alarmed about. |
| 28:57 | In this case this particular car used a Liberty clutchless gearbox. |
| 29:01 | So it's completely uninterrupted torque, there's no need for a fuel or ignition cut as the car changes gear. |
| 29:08 | So you can see here that our air/fuel ratio or lambda plot is pretty well flat. |
| 29:13 | Now we can see in this case I think we're targeting around about 0.65 lambda so we're a touch lean here in the lower gears but the car really wasn't on a good pass, it wasn't hooked up. |
| 29:25 | You can see right in the top end here, we're down at about 0.63 so within the range of what I'm happy with so at a glance there straight away I would know that my air/fuel ratio is on track and I'm quite confident with that. |
| 29:40 | Moving on, we can also have a look at our other engine vitals here. |
| 29:44 | So we've got our engine coolant temperature, and our air temperature, the inlet there. |
| 29:49 | This car used an ice water slurry that's pumped through the intercooler. |
| 29:56 | And you can see at the start of the run, the air temperature was just under 29°C and you can see it does a pretty good job. |
| 30:05 | It actually drops down to 27 degrees through the run and then at the end of the run we start to see the result of that boost pressure just at the point where the driver's backing off we're hitting 32 degrees. |
| 30:16 | So particularly given the fact, almost 60 psi of boost, that intercooler's doing its job. |
| 30:22 | We do need to manage these cars as well. |
| 30:24 | This is part of the process of running a drag car, making sure that we're managing the air temperature and more importantly probably the coolant temperature as the car comes up to the start line and this involves getting a bit of an understanding of when you need to start the car. |
| 30:39 | You want it obviously warm enough that you're not stone cold when you first start up, you don't want to go out there and do a burnout or a run with the coolant temperature stone cold but of course you don't want it to be too hot either and this becomes more important with these cars that don't run a proper radiator. |
| 30:56 | So controlling that temperature, important there. |
| 30:59 | Next we'll just have a quick look at our oil pressure and our fuel pressure. |
| 31:03 | So we can see that our oil pressure in the yellow here is moving around quite a lot and we do need to understand how to analyse this data. |
| 31:13 | Our oil pressure of course is linked directly to our engine RPM so naturally as our engine RPM goes up and down, we can expect some fluctuations in our oil pressure. |
| 31:23 | So again because this was such a shitty pass, we can see that the oil pressure through the first part of the pass is pretty ugly but the more important thing, what we're really looking for is anything where we would start to see a big dive down towards zero, that's going to be the scary thing. |
| 31:38 | Particularly with a drag car where the car might be pulling somewhere in the region of 2G off the start line, it's quite a common problem with a wet sump lubrication system to see that the oil pressure will drop as the car gets out towards the 60 foot. |
| 31:53 | We actually had the complete opposite problem with my old shop car back when it was wet sump, despite the fact that we'd gone to a lot of trouble to make sure that the sump was really really well baffled, it was fine during the actual run down the drag strip but when we got off the throttle, clutched in and popped the chute at 10,500 RPM, the deceleration would actually cause oil surge there. |
| 32:20 | So at that point the engine wasn't under any load which is probably fortunate but it was still probably spinning at 9000 to 10,000 RPM momentarily so nice to have a good solid supply of oil as at that point. |
| 32:32 | On this particular set of traces as well here in purple we've got our fuel pressure and this is a mechanical system, mechanical fuel pump, we should be seeing a pretty consistent fuel pressure through the run which is what we've got. |
| 32:46 | In most instances what we're going to find is that we will run a manifold pressure referenced fuel pressure regulator which means that our fuel pressure should step up in response to boost pressure. |
| 32:57 | So what this should maintain is a relatively consistent differential pressure across the injector and that's important to make sure that the injector for a given pulse width is supplying the mass of fuel that we actually expect. |
| 33:10 | So at this point we've gone through and checked our engine health, however what I'm going to do is just show you a little bit more information on that. |
| 33:18 | In this case we'll head back across and have a look at our DS9 data. |
| 33:27 | Yeah we'll have a look at it on this particular screen here. |
| 33:29 | So we've got four exhaust gas temperature sensors on the DS9 Evo and what we want to do is see what they're doing. |
| 33:38 | Now in the perfect world, we're looking for two things, or in reality what we're looking for is two things here. |
| 33:45 | We're looking for those EGTs to be closely matched, as you can see they are. |
| 33:48 | At the particular point I'm at here, we have a hottest of 768°C and a coldest of 757°C so generally if I'm within about 15 to 20°C variation across all the cylinders, I'm going to be pretty happy with that. |
| 34:05 | The other thing we're looking for is any sudden divergence away from the mean there. |
| 34:11 | So in this case, obviously we've got nothing there, all of those EGTs look pretty good. |
| 34:15 | At the start of the run here on the two step, we see that our temperatures are sitting around about 580 to 600°C and we'll just have a look at a little bit more data at the start of this run. |
| 34:27 | So you can see as the driver came up to the start line, around about 500°C so as soon as he gets onto the two step, those temperatures come up. |
| 34:35 | Let me get back into our actual data that I'm interested in here. |
| 34:42 | The EGTs do come up and then as we go down the strip, we see those continue to rise. |
| 34:49 | So the peak EGT that we're actually seeing there, right as the car goes across the finish line, we're somewhere around about 880, 870°C so we want to make sure that our peak EGT is under control and is sensible. |
| 35:05 | Need to factor in here a few considerations when you're deciding what your maximum allowable EGT is going to be. |
| 35:12 | First of all, the fuel that we're running on is going to make a massive difference. |
| 35:15 | If I saw an EGT of 880 to 900°C on an engine running methanol fuel, I'd be really scared because probably we'd have a molten set of pistons sitting in the bottom of the sump. |
| 35:27 | This is a gasoline based fuel that this car is running on so we're running on VP Racing Q16, generally with that fuel, I'd try and keep my peak EGT at or below 900°C. |
| 35:40 | We also need to understand that some turbocharger components can end up being damaged if our EGT gets too high. |
| 35:47 | In particular a lot of turbochargers will not handle sustained temperatures in excess of 1000°C so you need to be mindful of that before you end up damaging an expensive turbocharger. |
| 36:02 | Alright so we've gone over our engine health there, actually what I'll do quickly is just switch back to our other example here and have a quick look at our EGTs just to demonstrate that. |
| 36:15 | So we'll get into our drag run here, just because this is i2 standard, I am limited on the number of parameters but we can see, this is a good example of what I'm talking about. |
| 36:24 | This is only two of the cylinders of EGT data down the bottom here. |
| 36:27 | Temp one and temp two, cylinder one and two and we can see that the peak value there is 730°C. |
| 36:36 | Now despite that this engine probably made an additional 400 horsepower over and above what we saw with our DS9 example, the difference there, 250 difference in exhaust gas temperature is the fact that this particular engine runs on methanol fuel. |
| 36:55 | Alright so once we've gone through that, we're comfortable with everything, we can start looking at optimising the engine's performance and the car's performance out on the drag strip. |
| 37:05 | And this really again comes back down to just optimising the amount of traction available, optimising the power to suit the amount of traction available. |
| 37:14 | So what we generally do when we head to the drag strip for the first pass of the day, we basically lay down a exploratory pass just to see what the track's like. |
| 37:24 | We'll get a bit of experience just from even walking around on the start line, the conditions of the day, atmospheric conditions, air temperature, the amount of UV available as well, we're going to get a bit of an idea on how the track is likely to respond but generally I'm never going to roll the car off the trailer and set it up to go for its first pass on kill. |
| 37:44 | I'm always going to dial it back a little bit Just to make sure everything's responding, just do a basic check out path to get some data. |
| 37:51 | From here, what we want to do is first of all analyse the launch of the car, see how the car is launching, so let's head back to our data and we'll have a quick look at that. |
| 38:01 | So this is our point here in our data where the car hasn't actually launched yet. |
| 38:06 | So the levers that we've got available to us in order to adjust to launch setup, basically how much power the car is producing at the launch, we've got the ability to change the RPM set point on our two step. |
| 38:21 | So in this case you can see that we're bouncing around here at about 7300, 7400 RPM, that's pretty consistent. |
| 38:29 | Obviously this point here that I'm just highlighting, this is where the driver has actually released the two step control. |
| 38:35 | The other aspect we've got available to us in order to control our launch is the amount of ignition retard that we are using. |
| 38:43 | So again we'll have a look at that in a bit more detail, that's on our red trace here. |
| 38:47 | So you can see that our ignition is actually moving around a little bit. |
| 38:51 | At the start there when the driver first comes up onto the two step, we're actually running around about minus nine degrees, so nine degrees after top dead centre. |
| 39:00 | And that's quite aggressive to initially bring the boost pressure up. |
| 39:04 | So let's just cycle back across to the left a little bit. |
| 39:07 | You can see initially when the driver goes straight to full throttle, we've got very little boost pressure here, 35 kPa of positive boost and what we do is we then retard the timing quite aggressively, quite quickly, and that starts to bring that boost pressure up. |
| 39:22 | However by manipulating the ignition timing with respect to our boost target, this helps us to actually make sure that the boost pressure doesn't just keep going up. |
| 39:30 | There are other ways around this including wastegates on the intake setup to control excess flow but this is how we were doing it in this particular example. |
| 39:40 | So we can see here a spike in our ignition timing where it's actually gone back into positive values in order to pull our boost down. |
| 39:49 | What we were trying to do here is maintain a fairly consistent boost pressure around about 20 psi, so that's 240 kPa, which is exactly what we've got, well 140 kPa of positive boost pressure. |
| 40:02 | At this point here, you see that the ignition retard is removed, the ignition timing runs back to the normal values and the car starts to actually take up the clutch and move. |
| 40:11 | So what we're looking for here in this initial part here is how well did that work out? How good did we get that, did the car leave the line cleanly or did it light up and wheel spin or alternatively did it bog. |
| 40:23 | And in this case we've done a reasonably good job. |
| 40:27 | There's a couple of takeaways to consider in here. |
| 40:29 | First of all with this car we are using a clutch slipper device. |
| 40:33 | So this initial segment of the launch here, we can see the RPM starts to rise. |
| 40:38 | This marker here is where the car has actually cut the light and triggered the timing system. |
| 40:44 | So we actually have a little bit of, essentially a little bit of clutch slip on our plate there before the drive train will actually start to take up. |
| 40:52 | So that's not exactly perfectly tuned. |
| 40:55 | In the perfect world we wouldn't see any of that but that's what we're dealing with with a clutch slipper. |
| 41:00 | What we can see, initially one the clutch starts to bite is our RPM drops back down. |
| 41:04 | The key point here is this is the balance between too much wheel spin and too much clutch bite. |
| 41:12 | If we've got the clutch coming in too quickly or we don't have enough power, all we'll end up seeing is that RPM will just dive down, we might end up at 2000 or 3000 RPM and the whole run is aborted. |
| 41:22 | In this case we got it pretty good, we can see that the clutch starts to bite, it drags the RPM back down but it also keeps it under control and the RPM continues to climb up to the shift point without going straight onto the limiter. |
| 41:36 | So the other thing I'd be looking for is a situation where that RPM just sits up on the limiter like we saw in the Heat Treatments dataset before. |
| 41:45 | So that means we've got too much power to suit that track. |
| 41:49 | We can adjust this by either dropping our engine RPM, dropping our boost pressure or dropping both. |
| 41:54 | This needs to be handled pretty sensitively as well because we'll find that particularly these small capacity engines making a lot of power, it can be a pretty fine line we're treading and if you go too far, you might find that the engine isn't actually producing enough torque to leave the line. |
| 42:12 | So again, in this case I know that my launch is pretty good, it's suited pretty well to the racetrack, I've done a reasonable job of tracking the boost pressure to the grip available. |
| 42:23 | Looking at this, we'll also look at our traction and I've kind of touched on this as well, obviously we've got a little bit of wheel spin through first gear which is to be expected, second gear here the car is actually hooked up pretty well, third gear as we mentioned, we've got our little bit of wheel spin here and then in fourth gear again we've got a touch of wheel spin. |
| 42:42 | Now this is where we have a few more levers that we can pull in order to manipulate the amount of torque that the engine produces. |
| 42:52 | Obviously the key one here is that yes we can drop the boost pressure down. |
| 42:56 | Less boost we're going to make less power and torque. |
| 42:58 | However that can be a double edged sword. |
| 43:01 | Again with these bigger turbos on small capacity engines, we can see here that each shift, there is quite a period of time that it takes for the turbo to spool back up. |
| 43:14 | Even when we are clutchless shifting and the engine is staying at full throttle. |
| 43:17 | This is using an ignition cut that's somewhere in the region of about 50 to 80 milliseconds so it's a relatively quick shift but here on our second to third shift you can see that we've gone from 348, 349 kPa, to 286 so we've dropped significantly in our boost pressure and we've got to build that back up. |
| 43:40 | So in second gear where this car was severely traction limited, obviously we could drop the boost pressure but what that's going to do, if our boost pressure looks something like this through second gear, what we're going to find is that on that shift, we're then going to drop down further and that's going to end up affecting the boost performance through third gear where we're now relatively well hooked up. |
| 44:01 | So a little trick that we've used there which we can see in this data is I've actually used an ignition retard in second gear. |
| 44:10 | So that can be seen here. |
| 44:12 | So for example we can see that with 308 kPa, so 2.1 bar of boost give or take, we are only running 11 to 12 degrees of ignition timing, that actually retards back further. |
| 44:26 | So we're down to 10 degrees. |
| 44:28 | Now to put some perspective in that, at this particular point in our graph here, we've now got 2.8 bar, so much more boost pressure and you can see that I'm using 21 degrees of ignition timing. |
| 44:41 | So this is a little trick just using ignition timing and retard there to manipulate the amount of torque, allows us to keep the turbo at a higher boost pressure, getting better response when you get into that next gear where grip is available without sacrificing the boost response. |
| 44:59 | Sorry without sacrificing the traction through second gear. |
| 45:02 | So just another thing that we have at our disposal. |
| 45:09 | Alright so another thing again I've just mentioned already, we're going to be analysing those shift points to see if we need to make any changes to that. |
| 45:17 | We've gone through our launch sequence, we've looked at the available traction and how well we're mapping that. |
| 45:23 | If I had to make any changes for this car for a subsequent run, I'd probably leave everything pretty well how it is however what I would probably do is try just removing a little bit of that ignition retard through second gear. |
| 45:36 | It looks like the car is really well hooked up there in second gear, we haven't got any spikes so I might make a subtle change maybe add in an additional two or three degrees of ignition timing and just see how the car responds to that, Now another aspect that we have been looking at here that I've completely ignored so far is the fact that when we are using the MoTeC i2 software package, we have the ability to analyse data to suit what we're doing so if we go to file here and we go to workspace, we can see that we've got the ability to work on circuit workspace, drag workspace, engine workspace or rally workspace. |
| 46:17 | So it just sets up the i2 package to suit what we're actually doing. |
| 46:22 | Understandably here we are on the drag workspace and that allows us to enter information straight from the time slip. |
| 46:28 | So in this case that's what these red lines that we've got through the graph are. |
| 46:34 | Were able to enter those manually, we'll choose a point where the car starts to move and then we've got our start of our run, we've got our 60 foot point, oops let's try drawing a better straight line, we've got our 60 foot point here. |
| 46:49 | We've got the next point here is our 330 foot marker, then we've got our half track and finally at the end we've got our 1000 foot and then our 1320. |
| 47:01 | So this gives us the ability to view the data and overlay with other runs and we know exactly what's happening where. |
| 47:11 | Gives us a better way of judging exactly what part of the racetrack or drag strip we're on and what we need to do in order, where we need to make our changes but most importantly just a really powerful way of being able to analyse two runs back to back and see if we've made some changes, maybe we added some boost pressure or maybe we made a change to the timing, see how that's actually affected the performance of the car going down the drag strip. |
| 47:36 | I've already talked about the ability to use the shock travel sensors in order to highlight aspects such as the amount of squat we're getting on the start line. |
| 47:50 | Obviously that's important if you want to be able to optimise the suspension setup. |
| 47:56 | The other aspect that we'll see a lot with proper drag cars is the integration of the clutchless gearbox and the slider style clutch. |
| 48:07 | And when we've got an engine like that, a car like, we'll almost certainly want to have an input shaft speed sensor which is exactly what we've got here. |
| 48:17 | This is the green line here on our RPM data. |
| 48:21 | So what we can do, basically by monitoring this is we can see the performance of a slipper clutch. |
| 48:28 | And this is a bad example because most of the problem with this run was probably actually to do with an overly aggressive setup on the clutch. |
| 48:35 | We can see at this point here the driver is sitting on the two step limiter so the car's not moving so of course our gearbox input shaft speed is sitting at zero. |
| 48:44 | This is the key point here that we're interested in monitoring which is the point where the driver sidesteps the clutch and we can see how much clutch slip we've got. |
| 48:55 | In this case we can see that that input shaft speed basically rises almost immediately and the clutch locks up solid so this is essentially no different to having a conventional clutch and side stepping that. |
| 49:06 | What we really want to do is normally see this being much more controlled and gentle and it will rise and lock up with the RPM a little bit further through the run. |
| 49:17 | Now what this has caused here, because the clutch has locked up straight away, this is why the car's just gone straight into wheel spin and we see the RPM, both the input shaft and the engine RPM have climbed up onto the rev limiter and they've stayed there until the driver's got off the throttle. |
| 49:33 | What we can see here is a little bit more like what it's supposed to be. |
| 49:37 | These are our shift points here. |
| 49:39 | And we can see that on the shift point, the engine RPM drops and if the clutch is set up properly, this reduces the effect of the centrifugal weight on the clutch and it allows a little bit of slip on the gear shift. |
| 49:51 | Because otherwise with so much power being sent through the gearbox, if this was just locked up solid, those gear shifts can actually result in the car breaking into wheel spin, so we need to soften that hit on the gear shift and that's what we can see is what the clutch was doing, although this is a pretty bad example of that. |
| 50:11 | Right we are going to jump into questions and answers really shortly, I can see I've already got a few in there so we'll jump into those. |
| 50:17 | One last aspect that I did want to mention here is the logging rates that we want to use. |
| 50:24 | So these need to be chosen appropriately and sensibly. |
| 50:26 | What we want to do is choose a logging rate that is going to be suitable for the rate or the speed at which the particular sensor we're looking at is updating. |
| 50:36 | So let's have a look at an example here where this really isn't set up correctly. |
| 50:42 | And our exhaust pressure and manifold pressure trace is here from the GTR. |
| 50:48 | So our manifold pressure in dark blue here, inlet manifold pressure, this is doing a pretty good job, we can see we've got a lot of detail in this. |
| 50:56 | However we can see our light blue trace is really quite haphazard, it's all over the place and it doesn't really make a lot of sense. |
| 51:04 | Now if we want to consider why this is the case, what we can do is look at the sampling rate and what I can do here is press S and this will actually show us each of the samples, so every time a piece of data was taken. |
| 51:17 | And we can see that for the light blue data we have really few data points compared to our dark blue data. |
| 51:25 | I'll just press S again and we'll go back to the line graph but what we can do if we right click here on our manifold pressure, we can see what logging rate, logging frequency was used, in this case manifold pressure weirdly enough at 51.2 hertz, pretty specific but that's what it is. |
| 51:42 | And if we look at our exhaust manifold pressure, 10 hertz. |
| 51:44 | So what this means is our inlet manifold pressure is logged at 50 hertz. |
| 51:49 | Probably in reality actually faster than it needs to be, normally with inlet manifold pressure, I'd be at 20 to 25 hertz, there or thereabouts. |
| 51:57 | Exhaust pressure though, 10 hertz. |
| 51:59 | This is a sample that's moving really really quickly so looking at it only 10 times a second is not enough to give us really good data, we'll just get rid of our manifold pressure for a second. |
| 52:09 | And what this means is that for this particular piece of data here, we know we had a sample here at this particular point, we've got another one here, we've got another one here but what we don't know is what was happening between those pieces of data so the logging just basically averages those and assumes a straight line interpolation between the two values which might not necssarily be the case. |
| 52:32 | So for those sort of samples that are moving reasonably quickly, somewhere around about 20 to 25 hertz generally is a pretty good place to start. |
| 52:40 | On the other hand, you don't need to log all of your data that quickly. |
| 52:44 | If we consider for example something that's moving a little bit slower like our air temperature and our coolant temperature. |
| 52:50 | Generally somewhere in the region of two to five hertz is more than sufficient with that and we can see that we don't have a lot of data points there. |
| 52:58 | If we look at our engine temperature, that's logged at one hertz, our air temperature moves a little bit quicker than our coolant temperature so that's logged at two hertz. |
| 53:08 | So nothing wrong with that. |
| 53:10 | Obviously something like our exhaust lambda or air/fuel ratio of course we want to be logging at a reasonably high rate as well. |
| 53:19 | Alright so there you go, introduction to data analysis for drag racing, hopefully that's going to give you a little bit more insight into your options there. |
| 53:28 | We'll jump in and have a look at our questions now, if you've got any more, please feel free to keep asking them. |
| 53:42 | Manitou Black's asked, with a 36 minus two crank trigger will a typical hall effect sensor such as the Honeywell GT101 sensor have any issues keeping up or is it best to go with an inductive sensor? Good question there actually the GT101 sensor is problematic with high tooth count, missing tooth triggers and will tell lies. |
| 54:01 | So I definitely would not recommend using a GT101 with a 36 minus two at high RPM. |
| 54:07 | You quite likely will have issues with that. |
| 54:10 | 36 minus two I would probably use a reluctor style, variable reluctor pickup. |
| 54:16 | Plenty of options out there, really reliable sensor so no reason to not. |
| 54:21 | I actually did use the GT101 sensors on our 4G63 drag engines but we used a very simple 12 tooth trigger system, trigger disc on the crankshaft with a single tooth trigger on the cam as a synchronisation input. |
| 54:38 | Vikrant has asked, is the initial ignition retard present to allow torque to reserve at idle? I think you might be talking there about the ignition retard, so there's two aspects there, there's the ignition retard on the two step limiter and that's to help build boost up. |
| 54:53 | We use retard to basically ignite the combustion charge later in the engine cycle, this creates exhaust gas energy to help drive the turbocharger and produce boost pressure. |
| 55:04 | In the data I'm also using ignition retard on the gear shift and we'll just head back across and I'll just quickly load up that log file again. |
| 55:15 | I'll just show you that. |
| 55:17 | So if we look at the gear shifts, we can see that we're using retard on each of the gear shifts as well. |
| 55:22 | So the reason I'm using that retard there is two fold, first of all it's a torque reduction and helps with the shift. |
| 55:29 | Although the primary driver with those shifts is the ignition cut itself. |
| 55:33 | However by retarding the timing, when the ignition cut is complete, the engine torque will be reduced and then we can ramp that timing back in to help soften the hit in the next gear, it's just like the clutchless transmission, what we're trying to do is soften the gear shift so that the car doesn't get loose after the gear change. |
| 55:52 | And that's again a bit of a weighing things up there because retarding the timing is going to reduce our engine performance, hence we don't want to go too far with that but just making sure the car stays hooked up during the shift. |
| 56:05 | Alright we'll head back across to our questions now. |
| 56:14 | John Simon has asked, any tips for tuning a Magnus launch control device or any device of that kind for that purpose? Look it is a trial and error system really. |
| 56:25 | What I would say, for those who aren't aware, these launch control devices, it's a clutch slipper unit, it's a manual bleed valve that controls how quickly the clutch can release. |
| 56:35 | So creates a consistent and repeatable amount of clutch slip which is really important particularly in a four wheel drive drag car. |
| 56:44 | So what I'd say is generally you're going to need a lot slower clutch release than you actually think. |
| 56:50 | We sort of found that for our cars, around about 1.5 to two seconds from sidestepping the clutch on the floor to the clutch reaching its desired, the top of its travel was about right. |
| 57:02 | And obviously from there you can tune to suit the track. |
| 57:05 | The problem is you've got three different aspects you can control. |
| 57:08 | You've got your engine RPM for the two step, you've got your ignition retard which between the retard and the RPM will define how much boost pressure you leave the line with and then finally we can control how much clutch slip you've got. |
| 57:21 | So it's difficult for me to give you a specific set of operating criteria because it's just going to depend so much on the particular engine you're tuning. |
| 57:31 | What I would do is start probably though with setting the actual clutch slipper. |
| 57:36 | So the clutch might take about a second to come up full travel. |
| 57:39 | That's going to create some slip without any chance of destroying your clutch straight away and then you can work from there, make small changes and log the results and you're going to be able to see the effect of those changes. |
| 57:52 | And again we're looking for what I sort of showed you in that data where the RPM initially rises and then as the clutch grabs we see the RPM clamp back down and it's getting that fine balance between the RPM bogging or dropping too far and it lighting up and going into wheel spin. |
| 58:11 | What I would also say with this as well, just as a bit of a caveat is that those clutch slipper devices, incredibly hard on your clutch, probably should go without saying, it's not rocket science, you're creating a huge amount of heat in the clutch. |
| 58:25 | To put that in perspective, the triple plant sintered bronze material, the clutch plates that we were using in DS9, we would get 10 passes out of a full clutch, we'd throw the thing away, it was smoked. |
| 58:39 | Jamo's asked, you say you want a smoother RPM curve once you let off the clutch for a launch, is that only for driveline and clutch component wear? No the RPM curve, once you drop the clutch, is showing you how the car is responding, it's giving you some tips and some hints about how much traction is available. |
| 58:57 | So it's not a case of trying to get a smooth increase in our RPM because that's nice and smooth on the drivetrain, if our launch control strategy is set up correctly, we're going to inherently get that. |
| 59:11 | If we've got it wrong, we're going to get either bogging or going straight up onto the limiter so those are the things we're looking for there. |
| 59:20 | Vikrant has asked, does this vehicle have variable cam on both intake and exhaust? It has variable cam on zero of the cams. |
| 59:26 | When we start getting to this level, the size of the cam profile that we're running really dictates that cam control is of limited effect. |
| 59:36 | Basically we can't actually move the cam or swing the cam enough to be useful but as well as that we find that we're running over such a narrow RPM range, once the car's off the line, we're only really running between about 7000 and 10,000 RPM on those particular instances. |
| 59:52 | Probably actually higher than that. |
| 59:54 | There's not enough advantage in actually being able to move the cam control across that rev range to justify the additional complexities that come along with that. |
| 01:00:09 | Manitou Black, probably a question a little bit off topic for today's webinar, do injector spray patterns have a significant impact on low load performance and can this be tuned around? Really not a huge consideration in most instances for drag racing because generally our fuel requirements are quite large and we just need to get the fuel in there. |
| 01:00:30 | What you do need to understand is that yes, the spray pattern can have an effect on how the fuel is introduced, in most instances with OE production cars the manufacturers will run what is referred to as a closed valve injection strategy where the fuel is actually injected onto the closed intake valve. |
| 01:00:48 | Now that might sound a little bit counter intuitive but once the engine's actually up to operating temperature, what this results in is the fuel vaporising off the hot intake valve and port wall which means that when the intake valve is then opened, the fuel is brought into the chamber in an easy to combust format which is much better than even the most finely atomised mist of fuel out of an injector. |
| 01:01:11 | So the answer is yes it can affect performance everywhere, injection timing it can give us some benefits there, if you're interested in finding out more about that, we've got a couple of webinars in the archive covering injection timing. |
| 01:01:24 | Joey's asked, was the pre ignition damage on the piston you showed us due to a lean cylinder or a partially clogged injector or a hotspot developing or something else? What maximum EGT would you recommend for E85 or straight ethanol in a turbocharged engine? OK a couple of questions in there. |
| 01:01:39 | So this particular damage actually was the result of one injector failing. |
| 01:01:44 | So this was on an engine that ran three 1600cc Indy Blue injectors per cylinder and we ran one single injector as the primary and two parallel together as secondary. |
| 01:01:57 | So what we ended up with was a situation where one of the secondary injectors failed. |
| 01:02:02 | So we were still getting 2/3 of the fuel requirements into the engine but obviously that's not enough particularly on methanol, it has a relatively fine limit for the lean burn point or lean limit of how far you would push things so that pushed us over the edge. |
| 01:02:19 | In terms of EGT it's really difficult for me to give you a safe maximum. |
| 01:02:24 | The reason for this is there are so many other factors that will affect EGT which is why I don't use it strictly as a guide. |
| 01:02:34 | I will use EGT as a indication for individual cylinder fuel trimming, even though that in itself is not strictly true, we really in the perfect world for individual cylinder fuel trimming would use individual cylinder lambda sensors. |
| 01:02:49 | We may find, or almost certainly will find that when the lambda on each cylinder is equal, there will be a difference in EGT. |
| 01:02:57 | So the other aspect is it's not just the fuel that will affect the EGT, it's also the ingition timing and our boost pressure. |
| 01:03:08 | There's a number of factors in there and lastly to make things just a little bit more complicated, the ultimate number that you get out of an EGT sensor will also depend on where the EGT sensor is located in the exhaust and what type of sensor you're using, whether it's an exposed tip, which tend to read a higher value than an enclosed tip. |
| 01:03:26 | So with all that in mind, you can see that it's not particularly useful to guide you with a maximum safe EGT. |
| 01:03:32 | What I did mention in the webinar itself though is that the maximum EGT is useful for making sure that you're not going to damage turbocharger components, that sort of thing. |
| 01:03:47 | Another question, it's a follow up from Manitou Black who's asked, if we're using a reluctor sensor, can you still use a square tooth or are you better to use a pointed tooth? Actually you'll find that the square tooth is what is recommended, not a pointed tooth. |
| 01:03:59 | Most of the aftermarket sensors that are available that we use will come with a data sheet showing you exactly what specifications the tooth wheel needs to be in order to get a reliable output from it. |
| 01:04:14 | Shane has asked, what tyre recommendations do you have to lower 60 foot times? Shane that is such an ambiguous question that it's just impossible for me to give you solid details on, there's a million different aspects that will affect what tyre you may want to run. |
| 01:04:32 | In our case, with the Evo 9 example we were limited to what tyres we could fit to stay within a class rule, we would have loved to go to a 26 inch tall tyre which would have hopefully improved our 60 foot time down to the 1.1 vicinity but that wasn't legal. |
| 01:04:49 | There's the tyre, the width of the tyre, and tyre pressure, huge topic in and of itself, I'm sorry I can't really give you anything useful in terms of information there. |
| 01:05:01 | Rytrappo has asked, have been exploring clutch slipping strategies with a conventional clutch, I've been thinking about attaching a shock travel sensor to the clutch pedal to log this, have you heard of anyone doing this? I've heard of us doing this, we did exactly that on DS9 as well and this was all about trying to optimise the clutch take up point. |
| 01:05:20 | Basically we wanted to make sure that at the point where the driver engaged the two step, basically we wanted to make sure that we were right on the bite point of the clutch and there were two advantages with doing so. |
| 01:05:31 | First of all it's going to mean that it was going to help with the reaction times. |
| 01:05:36 | Never going to be perfect with a clutch slipper, you're not going to be pulling perfect lights with a clutch slipper but anything that gets us closer to that bite point is going to help. |
| 01:05:46 | The other aspect here is that it's going to help make sure that we've got a more consistent launch strategy as well. |
| 01:05:53 | So one of the ways we've done this is we've set up a shift light strategy to show a green when the driver is at the correct bite point of the clutch and then they can engage the two step limit. |
| 01:06:06 | So yeah absolutely can do all of those things. |
| 01:06:11 | Next question, was your car running water to air or air to air intercooler? So the Evo 9 example that we've looked through, that was running a bar and plate 600 by 300 by 100 front mount intercooler so air to air. |
| 01:06:25 | The Heat Treatments GTR ran a water to air intercooler using an ice water slurry. |
| 01:06:32 | Question here, it's a little off topic but let's jump into it, from Alexio who's asked, is it practical to convert an EFI car to a mechanical fuel pump on a street car that can be rated to 1000 to 1500 horsepower? If so, how would I set that up? Yeah look it's been done, there's definitely no shortage of people doing that. |
| 01:06:54 | I don't know if I'd recommend it, particularly if you're looking at 1000 to 1500 horsepower, that can be done easily with some of the brushless pumps and controllers that are on the market now. |
| 01:07:06 | Off the top of my head I think the one that Injector Dynamics have been working on for about the last billion years will handle about 2200 horsepower in a single pump format on gasoline so yeah it's totally doable, worst case scenario a couple of pumps will easily get you into that vicinity. |
| 01:07:24 | The reason I say that is that mechanical pumps aren't without their own set of issues, one of them is that you will struggle to produce enough fuel pressure at crank to get the engine to actually start up. |
| 01:07:36 | So quite often you'll find drag cars, they will start the car using engine start, maybe spraying in through the turbocharger if there's no intercooler or into a port on the plenum chamber just to get the engine to initially fire. |
| 01:07:49 | Once the engine's fired up, the RPM comes up of course, at that point the fuel pressure will also come up with a mechanical pump. |
| 01:07:55 | The other option is to run a high pressure electric fuel pump as a lift pump or a primer pump and this can be used when the engine is at cranking speed. |
| 01:08:07 | It provides a solution, it gets the job done, adds some complexity and you also need to plumb that in with a non return valve or a one way valve as well so that fuel won't back feed through the electric pump once the mechanical pump's up and running. |
| 01:08:21 | So that's my take in it anyway, at that power level personally I would stay electric. |
| 01:08:26 | Alright that has brought us to the end of our webinar, the end of our questions and of course as usual for anyone who has got further questions, please feel free to ask them in the forum after this webinar has aired and I'll be happy to answer them there. |
| 01:08:40 | Thanks for joining us, hopefully we'll see you all again next time. |
Timestamps
0:00 - Introduction
0:40 - Project DS9
1:45 - Why do we need data analysis?
2:40 - Project DS9 drag strip pass video
5:55 - Options for logging
12:55 - What do we need to log?
25:50 - Key considerations for analysis
45:50 - Entering time slip information
47:55 - Clutch slip
50:15 - Logging rates
53:40 - Questions