251 | Using RomRaider and MLVHD
Summary
If you’re reflashing using the RomRaider or ECUFlash software then understanding how to get the required logging out of the factory ECU, and how to quickly interpret it so that you know what changes to make to your calibration. In this webinar we’ll look at the RomRaider logger and how to utilise Mega Log Viewer HD to fast track your tuning.
| 00:00 | - It's Andre from High Performance Academy here, welcome along to another one of our webinars. |
| 00:04 | In this webinar, we're going to be discussing logging and how to basically go about logging and tuning using reflashing software. |
| 00:13 | Specifically here we're going to be looking at RomRaider which is very popular and common in the Subaru reflashing world. |
| 00:21 | However a lot of what we're going to be talking will also translate across to other scanning or logging packages because we are going to be looking at how to analyse the logged data, this is really the key to the whole situation. |
| 00:35 | Using a package called MegaLogViewer HD. |
| 00:38 | MegaLogViewer HD is a generic logging analysis tool so it will allow you to analyse any .CSV file which a lot of logging and scanning packages will generate. |
| 00:52 | It's nice if you are working sometimes in one package because you can get familiar with that particular package, learn its intricacies, learn how to use the tools that are available at your fingertips and you don't have to learn another package each time you switch to a different reflashing or scanning package. |
| 01:10 | Now as usual, we will be having questions and answers at the end of this lesson so if there is anything that you want me to dive into in more detail, please feel free to ask in the chat. |
| 01:21 | Now first thing we want to do is really start with why we need to use one of these logging and analysis packages in the first place. |
| 01:29 | And this really comes down to the difference between reflashing versus live tuning. |
| 01:34 | So if you are working in the aftermarket standalone world, if you've come from that background, then we have the ability to perform live tuning. |
| 01:42 | Simply put we can make changes live in our fuel or ignition tables and those changes instantly take place inside of the software. |
| 01:50 | At the same time, most popular current standalone aftermarket ECUs have their own built in logger straight in the PC tuning software so we don't need to switch between multiple software packages, we can do all of our analysis basically inside of the tuning software, at least for the purposes of our mainstream tuning jobs anyway. |
| 02:12 | On the other hand, if you are reflashing then in most instances, but not all, we can't do live tuning. |
| 02:21 | Instead we actually have to make our changes to the calibration offline, then we need to shut out engine down and then we need to flash those changes into the ECU which is a process that can take anywhere from perhaps 15 to 20 seconds through to a couple of minutes or more depending on the actual specific ECU you are tuning. |
| 02:40 | Now I did mention that this isn't always the case, for every rule there tends to be an exception and while originally when I first started reflashing, live tuning was almost unheard of, there are some options now, particularly with some of the commercial tuning packages such as COBB which have essentially rewritten how the factory ECU works. |
| 03:02 | Copied some of the tables temporarily into RAM which then allows them to be live tuned. |
| 03:09 | But this still isn't the norm and regardless, even if you are going to be performing, or if you have the ability to perform live tuning, being able to analyse some of your data after a run, either on the dyno or a wide open throttle acceleration test out on the road or racetrack is still beneficial. |
| 03:27 | Particularly under wide open throttle acceleration it's very difficult to see exactly what's going on. |
| 03:34 | Obviously you want to control the car if you're driving it on the road and it's very difficult to see every single parameter we may be interested in during that ramp run and this is where data analysis comes in. |
| 03:45 | Alright so now we've got an idea of why we need to use these techniques, we'll jump into what our options are. |
| 03:52 | Now obviously here I am primarily talking about Subaru so the options that are common there would be RomRaider, which is the one we're going to be looking at today. |
| 04:03 | There is also ecuEdit which is, its kind of open source in that it is relatively cheap, most open source software is completely free such as RomRaider. |
| 04:16 | ecuEdit, off the top of my head I think it's around about $100 USD payment so it's still incredibly cheap compared to some of the commercial options. |
| 04:25 | You can scan or log within ecuEdit, you can also use the likes of EvoScan as well, while it's called EvoScan it will actually work on Subaru too. |
| 04:36 | So regardless of which of those packages you are working in, essentially the process is still the same because the parameters or PIDs that you will be logging, these are really defined by the ECU that you're connected to, not the scanning package that you are using so doesn't really matter what you're personally using. |
| 04:56 | Let's just jump in for a moment here and we'll have a quick look so while I am using RomRaider primary as the scanner and we've got that set up here at the moment, RomRaider itself is actually also an editor so if we click here we can see this is the menu structure that we've got available for making tuning changes to our vehicle. |
| 05:19 | Now the reason I don't tend to use RomRaider for editing, which is a little bit beyond this topic but regardless whether you're using RomRaider or something else like EcuFlash which is my preference, you can't actually read and flash using RomRaider so you're still going to need to use EcuFlash to do the reading and writing so I prefer to keep the reading, writing and editing to EcuFlash and I still rely on RomRaider for my logging so again this is some of the complexities when you're working in the open source tuning world, often you will have to use multiple software packages depending on the particular task that you are trying to complete. |
| 06:00 | So if you want to use the RomRaider logger, we've got the logger up here, I've already got it running so you can come down and click on launch logger and that will give you this window here which we'll open up. |
| 06:12 | So there's a few options here, obviously you can choose the comport that you're going to be reading the ECU data through and in order to read this, you are going to need a OBDII to USB adapter so the one that is commonly used here is the Tactrix Openport 2.0 setup which, let me just see, I think I've got a, yep here we go, this is the Tactrix website. |
| 06:44 | You can have a look at that in your own time. |
| 06:48 | $189 USD for the actual adapter which is this one here. |
| 06:52 | There are a few adaptors, few connectors I should say that you can also purchase that come with this. |
| 06:59 | So particularly if you are reflashing Subaru, depending on the particular model, there's two different connectors that you may need which basically they're jumpers that you need to bridge when you're reading and flashing the ECU, there's a separate one as well for the Mitsubishi tuning world. |
| 07:15 | So you're probably going to be out of pocket around about $200 odd USD plus some freight depending on where abouts in the world you are so it's not a huge expense there. |
| 07:25 | So once you've done that you can get your data and you can start logging it. |
| 07:29 | So what we've got here, let's just open this up a little bit more. |
| 07:33 | We've got, at the moment we're on our parameters tab so this shows all of the available parameters or PIDs as they're often referred to and we can see as we scroll down, they're just in alphabetical order, it is a fairly extensive list which in itself can be a little bit confusing because you really need to understand what you need to be logging in order to be able to perform a certain task. |
| 07:58 | You might be thinking to yourself well why don't we just log every parameter then regardless of the task we can be assured that we are going to have the correct data available. |
| 08:09 | The problem is if we do this, the more parameters we log, the slower the transfer rate between the OBDII port and our laptop and if the data transfer rate becomes too slow, basically we're going to be missing big chunks of data. |
| 08:24 | If we're only getting maybe a couple of samples every second then significant changes can occur between samples that we're not going to be able to see. |
| 08:33 | So it's really important to try and minimise the data set that you are logging so that you maximise your data speed and this is going to just require you to change that log set depending on the task that you are completing. |
| 08:48 | We can actually see our logging rate is being displayed down here which at the moment is only 3.37 queries per second. |
| 08:56 | So that's in itself relatively slow. |
| 08:58 | So I've got a reasonably complete dataset here and I just want to go through some of the parameters that we have got. |
| 09:07 | So we start with a few of our parameters that tell us about our fuelling. |
| 09:14 | So we've got air/fuel correction one, we've got air/fuel learning one and these are essentially a long term and a short term fuel trim. |
| 09:22 | We've also got our air/fuel sensor one which is, in this case the factory fitted wideband air/fuel ratio sensor. |
| 09:31 | You can see what we'll get while we are logging, we'll get a minimum value, we'll get a maximum value and then we've got the current value so we can actually see while we're sitting here at idle, the values are moving around a little bit so it gives you some ideal of the scope of the minimum and maximum that you have seen during a particular session. |
| 09:54 | Now on top of this we've also got our closed loop versus open loop fuelling so this tells us the status of the system, whether it's in open loop, closed loop or in warm up. |
| 10:06 | Off the top of my head there I think seven, the status seven is warm up so eight and 10 is open loop and closed loop so it just gives you an indication of how the ECU's operating, we can actually see for exactly that reason the short term and long term fuel trims really aren't doing much at the moment. |
| 10:25 | So that's going to be important information to log if you are interested in looking at your fuelling which is going to be essential when we are tuning our mass airflow sensor scaling and when we are tuning our speed density sub system if we've got that sort of system in operation. |
| 10:44 | At the same time as well we do need to bear in mind that while the factory Subaru air/fuel ratio sensor is a wideband sensor, it's still primarily used by Subaru at or very close to stoichiometric so it's not really designed for full time closed loop control and for this reason, it's ignored when we are in open loop at wide open throttle and the accuracy of the sensor is a little bit marginal once we get to the air/fuel ratios we'd typically target at wide open throttle and full boost so while it can be used it does tend to read a little bit on the lean side so you're actually going to end up, if you're trusting that, with your fuelling a little bit rich so what I tend to do and I actually haven't got it connected for the purposes of our demonstration here, I actually bring in my own wideband air/fuel ratio sensor into this but I've got something that is trustworthy so you can see there we've got Innovate wideband air/fuel ratio. |
| 11:44 | So we quite often get asked, how do we do this? And this is actually relatively simple, we don't need to wire it into a factory sensor on the stock Subaru ECU, we can just bring this directly into our laptop and we can do this, if we go into our plug ins here, we can see we've got a selection of widebands that are supported by the RomRaider logger. |
| 12:08 | If we go to Innovate wideband air/fuel ratio and you simply select the comport so obviously at this stage I haven't got that connected so I'll click out of that, cancel. |
| 12:16 | We can also come across to our external sensors tab here and again we can see we've got our wideband air/fuel ratio sensor coming in and you can also choose to display those units in either air/fuel ratio or lambda to suit your preferences. |
| 12:32 | Important here to just make sure that you are matching your units and this actually goes for all of the units we are logging, we've got the option with some of our aspects such as our manifold absolute pressure to log that in psi, bar, kPa, absolute or gauge and you can get yourself quite confused if you aren't logging in the correct values so that's something we'll dive into in a little bit more detail, we'll head back across to the parameters. |
| 13:01 | So once that's set up, if we just connect the wideband air/fuel ratio sensor straight up to our laptop using a serial to USB adaptor so it is really straightforward. |
| 13:10 | The nice aspect with doing this as well is it ensures the integrity of your data and for those who have followed us for a while you'll know I sort of tend to beat on a fair bit about the potential inaccuracies that can come in if you are using an analog voltage output for your wideband because they are so susceptible to ground offsets which can make your data essentially completely meaningless. |
| 13:35 | So once you've got that in as well you can also obviously compare your actual wideband to your measured air/fuel ratio sensor from the factory and you'll be able to see that at cruise and partial throttle they do track pretty closely but you'll see those discrepancies start to move in once you go through to full boost, wide open throttle where it starts to get a little bit more inaccurate. |
| 14:00 | OK so we've look at our fuelling data there so that's going to be helpful for getting us on track for both our mass airflow sensor scaling as well as our speed density or load compensation tables in Subaru. |
| 14:14 | Let's just have a quick look at what they look like so we'll head across to the RomRaider editor. |
| 14:20 | So we've got our MAF sensor scaling here which is being displayed up here already. |
| 14:28 | So all we've got here is our mass airflow sensor volts and the airflow, in this case metric, grams per second. |
| 14:37 | So obviously this straight away suggests that if we want to be able to rescale this we need to be logging the mass airflow sensor voltage because that is our break point for this table. |
| 14:49 | So that's going to give us a guide on what parameter we need to be logging there. |
| 14:53 | But the other aspect and again, this is without trying to derail the webinar, this is quite unique to Subaru, there is some mechanical issues with the factory fuel system design that creates a little bit of weirdness in terms of high frequency fuel pressure oscillations. |
| 15:11 | There are quite prominent around 2800 to about 3400 RPM and they can play havoc with the fuelling. |
| 15:19 | Essentially it causes harmonics based on the frequency that the injectors are opening and closing and this causes pulsations in the fuel pressure which means that when the injector opens, sometimes it's delivering less fuel than it should be 'cause the pressure at the injector becomes lower. |
| 15:35 | Alternatively sometimes it'll inject more. |
| 15:37 | So in Subaru's infinite wisdom, rather than actually fixing the route cause of this problem that has been in existence right from the early GC8s. |
| 15:46 | Unfortunately in the version 11 Subaru, seem to become worse and this gets worse again with larger injectors. |
| 15:53 | So instead of fixing the route cause of the problem they just put a big old dirty bandaid on it which is these two tables that we can see here. |
| 16:00 | Load compensation cruise and our load compensation non cruise. |
| 16:04 | So we'll just open that table up and what we can see here is we've got a 3D table this time, we've got our engine RPM on our vertical axis and we've got our manifold absolute pressure on our horizontal axis. |
| 16:17 | So this is kind of just a way of adding or removing fuel based on what is required and straight away if you look at some of the numbers in this table, particularly around 2800 RPM and in vacuum so cruise areas, you can see we've got numbers peaking at 21% so that's how much additional fuel is being programmed to come in there so interesting that an OE manufacturer decided to put a software bandaid on a mechanical problem, yet here we are. |
| 16:46 | Interestingly as well in the aftermarket there are fixes for the mechanical issue, in particular COBB deliver a full fuel system upgrade and if you go with that it reduces or eliminates that problem with the fuel pressure pulsations, you can essentially zero that table out and concentrate on your MAF scaling. |
| 17:04 | So what this brings us to and why I'm going on about this is in the Subaru tuning world we're actually in a unique position where despite the fact that the scheduling for fuel and ignition is primarily off mass airflow, we actually do need to scale that load compensation table as well so we need to keep that in mind, which we're going to have a look at how that works as we go in a little bit further. |
| 17:30 | Alright moving down, we obviously also have a need to know what our engine RPM is. |
| 17:35 | Engine RPM is the load input, the axis input on a number of our tables so we've got our engine speed in here, the other one we've got here is our engine load so our load input is also really important if we look for example at our fuelling primary open loop table here and we have a look at that table we can see the engine load in grams per revolution is the load axis for that table. |
| 18:03 | If you're looking at these numbers and thinking wow, they're rich, yeah absolutely they are. |
| 18:08 | This is a stock Subaru fuelling map and we can see that particularly at high load they're targeting at some points into the 9:1 region which is just one of the reasons why with a reflash alone we can get significant improvements in the performance out of the Subarus in general. |
| 18:24 | So load is going to be one of our key parameters that we need to log in there. |
| 18:29 | In terms of our fuelling, another one that I've got a little bit out of order here but let's just go into this, which is our base, final fuelling base. |
| 18:41 | So this is essentially the commanded air/fuel ratio so it comes from the open loop table that we just looked at there when we are in open loop or under closed loop conditions, generally 14.7:1, of course our stoichiometric air/fuel ratio. |
| 18:56 | So the reason we need to log this is that between looking at our measured air/fuel ratio and our commanded air/fuel ratio, this will give us our error, basically how far away we are from our target and hence we know what correction we need to make either to our load compensation tables or our mass airflow sensor scaling to get us back on target. |
| 19:17 | So that pretty much covers our fuelling. |
| 19:20 | Our ignition control is the other, or one of the other two key ones that we need to consider here and here Subaru gets a little bit complex because instead of just having an ignition table or maybe a high octane and a low octane ignition table, they decided to do things their own way so in terms of the ignition tuning we have basically a base ignition table then we have an advanced table which is how much more ignition timing the ECU can put in based on feedback from the knock control strategy so there's another parameter in there and I know this starts to sound complex, which is the IAM or ignition advance multiplier also often referred to in other software such as COBB as DAM or dynamic advance multiplier. |
| 20:04 | Alright so how that works is we've got our base timing, essentially the minimum timing the engine will run. |
| 20:10 | Then we've got our advance map which is the maximum additional advance the ECU can add so it takes our ignition advance adder and it multiplies that by the ignition advance multiplier which is a number between zero and one. |
| 20:25 | If we've got no knock activity, that IAM value should be sitting at 1.0 and that's actually a really good health check for the quality of our tune, if we're seeing our IAM value drop away from 1.0, this means some knock activity is occurring and we need to inspect that. |
| 20:42 | So once we know that one multiplied by our advanced map value and that gets added in over on top of our base value. |
| 20:49 | So it sounds complex and if you do want to see that in a little bit more detail, we're not focusing specifically on that today, the EcuFlash worked example in the Practical Reflash Tuning course covers that in a lot more detail. |
| 21:02 | You'll also be able to see it in action. |
| 21:05 | So on that note, we do have our IAM value here and we can see that that is sitting right now at one so obviously again pretty good starting point, that's what we'd like to see. |
| 21:15 | Then we have our feedback knock correction which is this parameter here and we've got our fine knock learning so we want to look at these parameters, this will give us some guide into what the knock control strategy is doing. |
| 21:28 | Essentially our feedback knock correction is an instantaneous response to knock activity so we'll see that, immediately pull timing. |
| 21:36 | Our fine knock learning correction, basically if there is consistent knock activity and knock retard, basically this is a learning so there is actually a separate table that the ECU will start populating so that when it goes through that same zone of the ignition table it will immediately pull that timing preempting knock so those are the parameters that we're going to be looking at for our ignition tuning. |
| 22:00 | Then we've got our boost control so for our boost control, sorry actually mass airflow, I haven't really talked about the specifics here so we've got two parameters here, we've got our mass airflow in grams per second and then our mass airflow sensor voltage so again coming back to that, that's essential for filling in our mass airflow sensor scaling. |
| 22:20 | Then we've got our boost pressure, so in terms of our boost pressure we want to be logging, our target boost which is this parameter in here. |
| 22:29 | We want to be making sure here so we can see we are logging that in bar absolute. |
| 22:36 | We also want to be logging our current manifold absolute pressure which we've got up here and again we just want to make sure that our parameters are all matched so we've actually got something that we can overlay and compare. |
| 22:50 | No I don't want to reset the ECU. |
| 22:52 | So again if we scroll down through our list here, we've got our manifold absolute pressure parameters and we've got the option there of bar and PSI which I've just managed to draw over the top of and then we've also got relative pressure as well so depending how you want to display that, it's just really important that you are displaying parameters in the same values so that you can compare them at a later point. |
| 23:18 | If you are dealing with a datalog file where that isn't the case, I'll show you as well how you can get around that using math channels in MegaLogViewer in just a moment. |
| 23:29 | We also want to look at our primary wastegate duty cycle so the parameters we've just logged basically our target boost versus our measured boost. |
| 23:37 | That's going to show us how close we are, how much error we've got, are we overshooting, are we undershooting and we also can use that during a ramp run to basically sort of trim the boost target maps so it is realistic. |
| 23:51 | One of the problems we have with this car is because we have fitted a larger turbo, it is lazier to come on boost than stock which is pretty much to be expected. |
| 24:01 | However if we run the stock boost target tables we're going to be targeting boost pressure at let's say 3000 RPM that there is no way we can get to. |
| 24:10 | What this creates is a situation which is called integral windup where the closed loop control strategy is trying to drive the wastegate duty cycle harder and harder to get to this target that's unachievable and what happens is that when get to an RPM range where we can create boost, the boost will essentially overshoot so getting the target realistic to what the engine can actually produce is really important to get good boost control. |
| 24:35 | Then we also have our turbo dynamics so we've got our integral and our proportional gain elements. |
| 24:43 | So this is just showing us what the ECU is actually doing to manipulate the final wastegate duty cycle in order to try and get to our target. |
| 24:52 | In the perfect world, what we want to do is see the integral and proportional gains once we're in boost control sitting relatively close to zero so they're not doing a lot of work. |
| 25:02 | So that's a reasonably complete list there, it's not the only parameters that we may want to log. |
| 25:09 | For example if we look at our parameters over on the left hand side, we've got our intake VVT advance values so we can see what our variable cam control is doing, we've obviously got that for our exhaust as well if we scroll further up. |
| 25:25 | One of the aspects that is really beneficial to log as well as our injector duty cycle, just to make sure that we're not exceeding the maximum values there. |
| 25:35 | We'll also come down here, another one that is at least worthwhile having a look at is our requested torque. |
| 25:43 | The reason for this is in terms of our boost control, if we come over to our boost target map here and we have a look at our target boost, we can see that the value on the load axis of this table is requested torque. |
| 25:57 | We can infer this by looking at the lookup table for torque versus throttle position as well so it's not the only way but it's a nice quick and easy way to actually see exactly where abouts we are sort of moving through this table as we go through a ramp run and that's going to allow you to do a better job of seeing what the boost targets are and what they need to be. |
| 26:18 | Alright so I think we've probably covered at this point the majority of the parameters that are there. |
| 26:24 | There's obviously other parameters that you may want to monitor for specific tasks. |
| 26:28 | These are not an all encompassing list but it is certainly a useful list. |
| 26:34 | Now at the moment we are logging, or we're reading the data so we've got this little green status showing that and it says reading data. |
| 26:43 | That's useful to have a look at what's going on and as we're continuing to sit here idling, the numbers are always chaning. |
| 26:52 | However we're not going to actually create a log file out of this. |
| 26:55 | In order to do this we need to click this little button here which says start log file. |
| 27:00 | And all that's going to do is automatically create a file, we can see where abouts that's going to go as well so we know where to recover it from or retrieve it from later on. |
| 27:10 | And that will generate our log file. |
| 27:13 | Now the other aspect here as well is we can actually look at everything inside of the RomRaider logger and in particular, I know someone's probably going to ask here, why am I not using the RomRaider built in option for scaling our MAF and this is just personal preference so this is really what comes into a lot of our tuning. |
| 27:43 | There is no black and white, this is the way we must do it. |
| 27:47 | There's a lot of options sometimes and it comes down to personal preference on how you want to do it. |
| 27:53 | The reason I prefer to use MegaLogViewer HD is twofold, first of all as I've already mentioned at the start of this lesson, we are only learning one package and we can then use this across multiple reflashing or aftermarket standalone ECU tuning sessions so that's quite helpful. |
| 28:10 | Personally I also find that the MegaLogViewer HD software allows a little bit more control and finesse in rescaling the likes of our mass airflow sensor than focusing on using RomRaider itself so we'll head back to our data. |
| 28:23 | At this point we're going to assume that we've created a log file. |
| 28:27 | So we now want to figure out how to interpret that. |
| 28:32 | Actually before we do that, also just worth mentioning how to drive the car while you are gathering your data because when we are performing any tuning based on datalog, datalogged information, it really comes into a situation where garbage in results in garbage out so we want good quality clean data to give us the best chance possible of getting good results. |
| 28:56 | So what do I mean by this? What we want to do is make sure that before we start logging, the car is up to, the engine is up to normal operating temperature. |
| 29:05 | And this doesn't just mean that the engine is hot, particularly if we are road tuning, what we're going to be doing is spending a lot of time driving and then we'll be pulling over on the side of the road or coming back into the pits if we're lucky enough to have racetrack access so we can analyse what we've logged while we've been out on track and then make our changes. |
| 29:23 | So what this results in is a lot of heat soak in the engine bay. |
| 29:26 | And we need to get rid of that heat soak and get back to realistic operating conditions before we start logging data again. |
| 29:33 | So once we get started, get back up and running, we want to drive the car for maybe two or three minutes at speed on the open road, on the racetrack, just get airflow through to get rid of that heat soak condition. |
| 29:45 | So that's one thing, the other aspect is that we want to be really smooth with our throttle application. |
| 29:51 | So particularly if we are scaling our mass airflow sensor or those load compensation tables that we looked at, we want to make sure that we aren't being aggressive or erratic on the throttle because this is going to bring in transient enrichment and that's going to generally result in data that's not that meaningful. |
| 30:09 | So really nice smooth inputs. |
| 30:12 | Now this can be a little bit difficult, particularly if you are driving on the road because obviously at some point you're going to probably need to come to a stop at a set of lights or a give way, maybe you're going to need to change gears, almost certainly you're going to need to change gears so there's a limit to what you can do here. |
| 30:30 | Good way of getting around this is if you've got access locally to some open road driving where you don't have to start and stop, I would focus on getting up to speed, getting onto the open road, into maybe fourth, fifth or sixth gear before you actually start your logger and then you don't need to go through those gear changes. |
| 30:49 | Then other aspect here is particularly for our MAF scaling, it is worthwhile generating a large log file with a lot of samples and what we're going to be able to do here is filter through those using the histogram function in MegaLogViewer, don't worry we'll get into that in just a second. |
| 31:07 | And that's going to give you a lot more data points for the same cell in our mass airflow sensor scaling table for example. |
| 31:15 | And this means that the odd outlier is going to essentially be outweighed by the rest of the data, giving you more solid results. |
| 31:23 | So just important to mention those aspects there. |
| 31:27 | Alright what we'll do is we'll head across to MegaLogViewer HD. |
| 31:30 | Now I am a little bit limited here, unfortunately due to a little bit of a time crunch here, I haven't actually been able to get access to the log files I really wanted to show you but that's OK because we're going to be concentrating on the fundamentals here so regardless of the actual logged data that we're looking at here, if you understand the fundamentals then you're going to be able to manipulate this to suit. |
| 31:54 | MegaLogViewer HD, if you haven't ever heard of it before, this is basically from the same people who brought us MegaSquirt MS3 Pro. |
| 32:04 | There is a small fee associated with MegaLogViewer HD, you can start off with their free version to get a feel for it. |
| 32:11 | I think the full version is about $25 USD. |
| 32:14 | Honestly it's a drop in the ocean for the power this gives you so it is really worthwhile. |
| 32:20 | So at the moment I've got my log file opened up so basically it can import any .CSV file so particularly if you are dealing with an aftermarket standalone ECU, you can still use this, you may need to actually export your log file from your ECU in .CSV format. |
| 32:39 | Not every ECU can do that but most can so that's just something to keep in mind. |
| 32:44 | Now at the moment we are on the log viewer tab, you can see up the top here we've got a bunch of different tabs depending on the task that you want to deal with and really how you want to view your data is going to depend on the data, the tuning task at hand. |
| 33:01 | This particular data we've got here was for some mass airflow sensor scaling so you can see at the moment we've got RPM on our top graph and we can see maximum RPM is sitting at 4200 RPM and we can see through this log file here I've sort of varied the RPM quite dramatically using small inputs on our throttle. |
| 33:23 | We can actually probably also bring in our throttle, if we scroll through you can see while I'm doing this, this is how we add a different parameter into our graph. |
| 33:33 | So there we go, our throttle position trace and we can see again, maximum throttle, 46% so obviously I'm not trying too hard here. |
| 33:41 | So our next piece of data down here, we've got our air/fuel ratio sensor. |
| 33:48 | So this is the factory sensor and we've got our final fuelling base. |
| 33:52 | So remembering here that these are the two parameters you want to overaly. |
| 33:57 | Essentially this is telling us how close or far away from our target we are. |
| 34:02 | If our mass airflow sensor scaling is correct essentially we should find that our air/fuel ratio measured, our air/fuel ratio and our target air/fuel ratio line up really really nicely. |
| 34:14 | This is using that factory wideband sensor. |
| 34:18 | Nothing wrong with doing this for the closed loop portion of your operation. |
| 34:23 | As we've already dealt with here, generally it's not going to be super accurate for wide open throttle operation. |
| 34:29 | So if you are bringing a wideband in then it would make sense to just use that for all of your tuning. |
| 34:35 | Little tip here as well is the scaling so particularly when you load up a fresh log file with a parameter like your wideband air/fuel ratio sensor, it's going to auto scale that between the minimum and maximum values. |
| 34:48 | Now there's nothing strictly wrong with that but where this can be a little bit misleading is if you load up like I've got here, your target or commanded air/fuel ratio and your measured air/fuel ratio and they auto scale to different values. |
| 35:02 | At a glance it can look like your values are offset and that there's a big error in your data, whereas that may not be the case so to correct this we can just come over here to our little burger menu and we've got our air/fuel ratio sensor one. |
| 35:17 | So auto scale is how it's normally going to look and we can come down here, untick auto scale and we can set a minimum, let's say 9:1 and I think we were 15:1 already and just basically however you want to display that. |
| 35:32 | You want to essentially get good resolution in there so you can actually see what's going on. |
| 35:36 | Now what we can do is click essentially anywhere in this file and you're going to be able to see the live values at that particular point. |
| 35:44 | Now we do need to be a little bit mindful here though because if you are running in closed loop mode there's going to be our air/fuel corrections in play. |
| 35:56 | So generally, if everything's working well and the closed loop control is working well, if you're just viewing our wideband air/fuel ratio data, overlaid with our target, they essentially should be very similar. |
| 36:07 | You can see, in this case, they're not but take my word for it, they probably will be. |
| 36:11 | So to get a better idea of what's going on, let's just open up some more data down here and we'll bring in our short term and our long term trims. |
| 36:20 | So we've got those now being displayed together and those are down on this graph here. |
| 36:26 | So we can see those moving around, that's actually not too bad, everything's pretty close to zero. |
| 36:32 | Again it can help to just make sure your scaling is correct. |
| 36:35 | If we look here we can see we're manually scaled between minimum of -20 and a maximum of 20% so basically we should, with everything dialled in correctly, be seeing these sitting around about the centre. |
| 36:50 | So they're not, they're doing some work but how can we use that data to help us with our mass airflow sensor scaling? Well this is where math channels come in so we've got one that I've created in here called total trim and essentially all this is doing is looking at the total or adding together the short term and the long term fuel trim to give us a total trim value. |
| 37:15 | So if we look at this particular point here, we can see that our total trim is 1.6 so there's obviously a resolution error, we've got a short term trim of 2% positive, long term trim of -1% so let's have a look at how the calculated values or math channels work so we'll come up to our calculated fields drop down menu. |
| 37:37 | And we've got some pre configured, what we're going to do is come down to custom fields and you can see that I've got a list here of ones that I regularly use. |
| 37:47 | And you can also add your own custom field here. |
| 37:51 | I won't go through that process because it's pretty self explanatory but we'll have a look at how that works. |
| 37:58 | So if we come down to total trim which is the yellow log parameter that we've got open there, we can see that the formula is our AF correction 1, so this is our short term fuel trim plus our AF learning 1. |
| 38:12 | So not exactly rocket science there, you can click edit and that'll allow you to change that if you want. |
| 38:20 | We will just quickly show you how to create one though so if you click on add custom, obviously you can give it a name, whatever you want. |
| 38:27 | Now with the formula, it says exactly what you need to do so basically, follow the simple instructions, control and space is going to bring you up a list of all of the available parameters that are logged and then you can just use normal math functions in there. |
| 38:43 | Obviously this is really simple, I'm just adding them together and that gives us our total trim. |
| 38:48 | Now when I'm doing this in open loop mode, so for a ramp run for example, as I've already discussed, the on board wideband sensor, not really that good so when we are in open loop mode, our closed loop trims, particularly if there's no learned data are going to be sitting on zero. |
| 39:06 | So those aren't going to help us, that total trim parameter is going to be completely useless to us. |
| 39:12 | However we've got another calculated field that I've created here, if we go down to our custom fields. |
| 39:17 | We've got air/fuel ratio error, so it's this one here. |
| 39:21 | Which if we look at the formula here, we're taking our Innovate wideband air/fuel ratio, dividing that by our final fuelling base so we're taking our measured air/fuel ratio, dividing it by our target and then we're expressing that as a percentage so that's going to give us our error and again if you've been through our EFI Tuning Fundamentals course, you'll know that that's our simple formula that we use for correcting our air/fuel ratio regardless of the ECU, we've got our measured air/fuel ratio, divide that by the desired air/fuel ratio and then that will give us our percentage correction to apply to our fuelling table so it's exactly what we're doing here and if we generate that piece of data, we can use that under open loop control conditions. |
| 40:03 | So unlimited number of options for how we can use this as well. |
| 40:09 | We've even got down here, our MAP psi so we can actually generate a manifold pressure signal from a metric, so from bar, we can convert that into PSI if we haven't logged in the correct parameter. |
| 40:27 | Alright so we've got all of our data, we kind of know what we're looking at here but when we're viewing this data like this, it's a little difficult to really decide what we should be doing with it, where do we go to correct our mass airflow sensor scaling, we've got a lot of data gathered so it can be really overwhelming. |
| 40:46 | This is where one of the most powerful functions I believe in MegaLogViewer comes in which is our histogram. |
| 40:53 | So we'll head across to our histogram and table generator here. |
| 40:57 | So we can set up these histograms basically to match the tables in our ECU that we're interested in correcting. |
| 41:08 | So what we've got here is actually a 3D table, now this might sound a little bit weird because when we are rescaling our mass airflow sensor, generally it's a 2D table, let's just reiterate that, we'll come back over, right, 2D table, we've got our mass airflow sensor voltage there, that should be our axis. |
| 41:27 | Awkwardly this represents our MAF scaling on the horizontal axis whereas EcuFlash which I actually use does it on the vertical which is why I've set up that table the way it is but basically what we want to do is set the table up ideally with the same break points as well as the table in our ECU. |
| 41:47 | Not completely essential but it's certainly going to help. |
| 41:49 | Now, let's head back over to MegaLogViewer HD so that's what our vertical axis here is. |
| 41:56 | Let's see how we can set that up. |
| 41:58 | We've got our axis fields here so our X axis, our horizontal axis, we've selected RPM, I'll deal with that in a second. |
| 42:06 | Our Y axis, vertical axis mass airflow sensor voltage, again this is why it's so important to be logging the voltage parameter. |
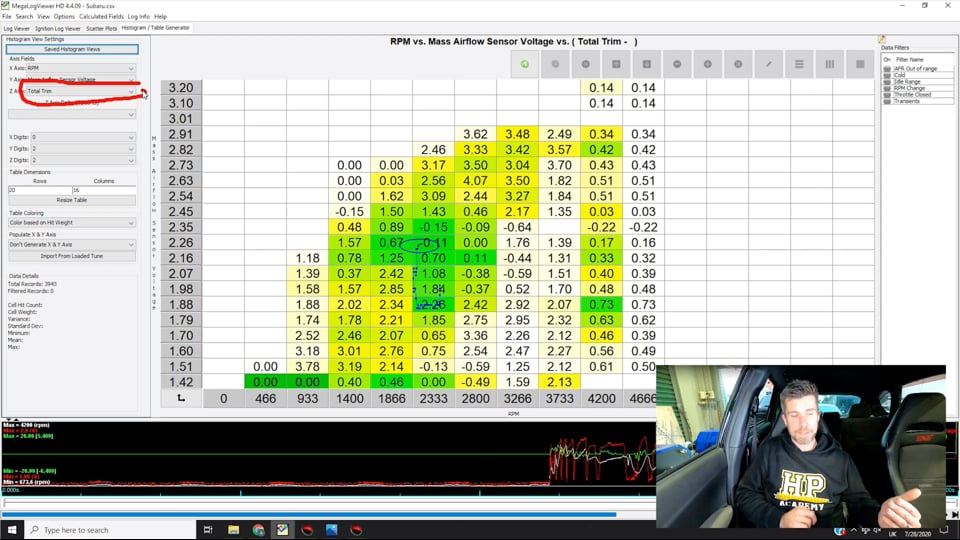
| 42:14 | And then the parameter that we're logging in on the Z axis, so what's basically going to populate this table is our total trim value. |
| 42:21 | Remember that's our air/fuel ratio correction, our short term plus our long term fuel trim, the total amount of trim. |
| 42:28 | If everything is dialled in really nicely, what we should see is a table that doesn't look too dissimilar to this, basically everything should be within perhaps plus or minus 2-3% of zero which is essentially what we've got. |
| 42:44 | We've got a few outliers here around sort of 3.5, 4% but probably nothing that I'd be particularly worried about. |
| 42:52 | Now the colouring on this is also important to mention here. |
| 42:56 | So we can see over here on our data details we've actually recorded about 4000 total hits while we've been gathering this data and basically the colouring here is based on our hit weight or essentially how many pieces of data or samples we've got for each of our cells so the ones that are bright green, means we've got a lot of good quality data there so we can be pretty confident that the data is reliable, in fact the cell that I'm hovering over there, we can see we've got a hit count of 199 so basically 200 samples for that particular cell. |
| 43:30 | We need to be a little bit more mindful when we start seeing data that is white like this, if we hover over one of these we can see that we've only got 11, eight, seven hits so I'd be a little bit more sceptical of the values of that data and this would really suggest that if we want to be really really accurate there, we'd want to go back and actually gather some more data at 3200 RPM. |
| 43:54 | Right so that's how it works, we've got a few more ways of manipulating this, we can set up the number of rows and columns for our table. |
| 44:03 | Again just to match broadly the data that we want to collect. |
| 44:07 | If you want to, you can click down here and you can also set up the axis break points so it just depends how fussy you want to get here. |
| 44:15 | Now the reason though that I have included the X axis here is just coming back to the little problem that I mentioned before with the load compensation tables. |
| 44:27 | So when we are scaling the mass airflow sensor on the Subaru ECUs, it's sort of actually a two stage process because, while it's primarily driven by the mass airflow sensor scaling, we do also have this little sucker in here where it's adding a butt tonne of extra fuel to get around that problem in the fuel system. |
| 44:49 | So what this can mean is particularly if we didn't know this was doing on and we were unfortunate enough to try and scale our mass airflow sensor at 2800 to 3000 RPM, you can see we're also being influenced dramatically by those huge trims in there. |
| 45:03 | And essentially if this mass airflow sensor, sorry if this load compensation table wasn't right, we wouldn't know whether our error was coming from that or our mass airflow sensor scaling so just getting a little bit more specific about the Subaru ECUs, let's see here, we find that generally in our load compensation table we've got little to no activity down at 2000 RPM and again we've got little to no activity up around 3800 RPM and above. |
| 45:32 | So what I like to do is gather data at 2000 RPM, then gather data at 3800, 4000 RPM and then we're skirting around the main area where we see problems in that table. |
| 45:45 | So basically what I'm getting at here is if we say scan some data at 2.5 volts mass airflow sensor voltage at 2000 RPM and our air/fuel correction is essentially zero and we do exactly the same at 3800 RPM and we've still got essentially zero short term and long term fuel trim activity, then once we've done that, we've got our mass airflow sensor scaled, what we would do is then come back and have a look at what's happening at 2800, 3000 RPM. |
| 46:12 | If we've now got an error, we know that the error's not from the mass airflow sensor scaling, we know it's actually from this situation here and we need to make corrections to this table. |
| 46:23 | I know it's a little bit complex, it does take a little to get your head around but it actually isn't too bad. |
| 46:29 | We just need to know that when we're focusing on our mass airflow sensor scaling, we need to be either side of that area where we see those massive trims in our load compensation table. |
| 46:38 | And that is why, if we head back, I have added RPM on this horizontal axis. |
| 46:42 | Because if we start seeing wild trims in around here, then that gives us a pretty good insight into where our error is. |
| 46:52 | So we're looking, in this case, say 1800, 2000 RPM we'd be looking at our values, all pretty good, +/- 2%, not unhappy with that and then we'd be looking at 3800 to 4000 RPM. |
| 47:04 | Again I don't have a lot of data points but pretty much exactly the same situation there. |
| 47:10 | So that's how we can use the histogram for our closed loop fuelling where we're targeting stoichiometric. |
| 47:18 | However when we go to wide open throttle, things are a little bit different here and with our wide open throttle we're going to be changing our total trim parameter, because remember on open loop mode our trims will be sitting at zero, we're going to be selecting our other calculated value here which is our AFR error Subaru. |
| 47:39 | So remember that's just our calculated error between our measured air/fuel ratio from our wideband and our target. |
| 47:45 | So very very powerful way of quickly gathering a lot of data and analysing that data. |
| 47:52 | Does take a while to set up these histograms so you can also save your histograms, so if you come up here to the save histograms view, click on that, I've got a few here that I've set up, we've got ones for Ecumaster, Haltech, load comp for Subaru which is what we're looking at now, MAF scaling and MAP comp as well. |
| 48:11 | So always a good idea, once you've spent the time dialling this in, you've got something that works, we'll make sure that you save it so it's nice and easy to come back to at a later point. |
| 48:20 | Now last topic that we're going to talk about here, so this is a good point to mention, if you've got questions, please feel free to ask them, we're going a little bit long here as well. |
| 48:30 | The last topic to mention here is that often you're going to be in that situation where gear changes or getting completely off the throttle is unavoidable. |
| 48:40 | Now in that situation you're going to be generating data that is essentially garbage and it can really skew your values. |
| 48:46 | Particularly for example if you get completely off the throttle, the ECU is going to go into overrun fuel cut so the measured air/fuel ratio is going to be incredibly lean and what that'll mean is down here, particularly at low RPM or MAP values it would be, you will end up with some really really larger errors, maybe as much as 70-90%. |
| 49:08 | Now that's not to say that that is actually a problem. |
| 49:11 | The other thing as well, I've mentioned that you should be smooth on the throttle but sometimes transient enrichments will come in so you've got the option to trim some of these out using data filters which are over here on the right hand side. |
| 49:24 | So what we've got here is air/fuel ratio out of range cold, we've got idle range, RPM change and throttle closed and transient. |
| 49:34 | So you can use as many or as few of these as you want. |
| 49:37 | Throttle closed, pretty self explanatory, this just removes data when the throttle is below a certain point. |
| 49:45 | Transient so we can bring in here rate of change of throttle. |
| 49:49 | Cold if our engine is cold. |
| 49:51 | We can edit these to suit the particular parameters that we are using as well as what we actually want to log out. |
| 49:59 | So throttle closed, we don't actually have that set up, oh yep, our field throttle position is less than 10. |
| 50:07 | Now this does get a little bit complex because you are going to need to go through and modify these based on what the parameter ID is actually called so in that case you can see the field is labelled TP. |
| 50:18 | I think I've actually done this for some Ecumaster tuning. |
| 50:22 | In the Subaru ECU we don't have that parameter TP which is why that's not valid. |
| 50:27 | We instead have throttle opening angle I think from memory it's called. |
| 50:32 | So there is a little bit of work in setting this up but once you've got it up and running, it's very very powerful and you can set up a fairly extensive list of these data filters as you go. |
| 50:43 | You don't have the overwrite the existing ones. |
| 50:45 | Alright so hopefully at this point you've got a better idea of MegaLogViewer HD and as well as how it can be used to help fast track your tuning process with the likes of open source reflashing. |
| 50:58 | This has essentially only scratched the surface of some of the powerful aspects of MegaLogViewer HD but these probably are the key ones that I use on my day to day tuning. |
| 51:08 | Right now we'll jump into our questions so if you do have any more questions, please keep them coming. |
| 51:27 | Right Kevin has asked, how do we compensate idle air/fuel ratio for large injectors on RomRaider or EcuFlash where minimum pulse width table doesn't exist? That's a good point Kevin, sometimes depending on the definition you've got you may not have access to every parameter that is available so this really comes down to the quality of your definitions and whether something has been defined. |
| 51:51 | Depends as well on how big your injectors are, I've tuned a number of Subarus and as well Mitsubishi using 1000cc injectors and have no problems getting a stoichiometric air/fuel ratio at idle so kind of depends how far you're going to do. |
| 52:08 | This can be some of the limitations as well with reflashing, particularly in the open source world where you are kind of at the whim, if you aren't capable of doing your own definitions, you're at the whim of the wider network or community as to how good those definitions are. |
| 52:25 | Next question from Canvasaw has asked, have you guys worked with Car Berry ROMs, they seem to extend RomRaider a fair bit definition wise? No unfortunately I haven't so not something I can really dive into there I'm sorry. |
| 52:40 | Full sent has asked, what is your preferred open source platform? Look it really does depend on what you're trying to tune. |
| 52:48 | Probably my go to, the one that I've got the most experience with and the most familiarity with is EcuFlash. |
| 52:55 | Tends to be a pretty good all rounder but the problem we see is that being based here in New Zealand the cars that we get access to are almost invariably Japanese domestic market models. |
| 53:07 | Because the larger enthusiast network is based in the US, obvious there, the US domestic market model reigns supreme, we can find that there are limits on the definitions for some of the JDM ROMs which can be problematic again if you aren't able to write your own or find maps of your own ROM. |
| 53:25 | So yeah EcuFlash for me, the other one would be ecuEdit. |
| 53:29 | I kind of lump that into open source as I kind of mentioned, yes there is a cost which I think is very very low for the quality of the product. |
| 53:38 | The advantage with ecuEdit is that it is a little bit more fully featured, it's got its own built in logger so you don't have to switch between EcuFlash and RomRaider for logging or whatever your preferred logging package is. |
| 53:51 | The other thing with ecuEdit is you kind of get a little bit more guidance on the maps and the way they interact, particularly again if you are new to reflashing it can be a little bit daunting understanding the interaction, particularly for example as I've talked about today in the Subaru world, the interaction between the base ignition table, the advanced adder table, the ignition advance multiplier. |
| 54:12 | So there's a little help file or help description below each of the maps telling you what that map actually is and some information about the interaction with other maps so that can help you find your way a little bit. |
| 54:25 | Full sent's also asked, what's your preference between Adaptronic and COBB? Well they're completely different platforms for completely different applications so I don't think it's really fair to compare them. |
| 54:36 | Adaptronic obviously is an aftermarket standalone ECU, COBB is a reflashing software so COBB for the vehicles that are supported is excellent and I've always been an advocate that if you are going to be tuning a car where you've got reflash support and you're not going completely wild, then reflashing is usually almost always the most cost effective solution. |
| 55:01 | Interestingly even if you are using COBB, as you'll see with our COBB worked example in our Practical Reflash Tuning course, we still rely heavily on exactly the same MegaLogViewer HD analysis package that we've used today. |
| 55:13 | So that being said, there are also instances where an aftermarket standalone ECU is absolutely the correct course of action. |
| 55:21 | It's becoming more of a grey area these days, it's not really a power level that you have to go to an aftermarket standalone like an Adaptronic. |
| 55:30 | Generally if you want motorsport functionality, a little bit more flexibility in sensor input, actuator output then aftermarket standalones will give you that over reflashing. |
| 55:42 | Samuel has asked, I have a 2008-14 WRX fuel rail and DeatschWerks 1200 cc injectors, how do I compensate for the fuel trim irregularities if my table only has eight points in RPM axis and only goes to 2000 RPM? I'm not sure what table you're talking about there, so if you're referring to the problem that we've talked about today with the fuel system issues and your car absolutely will have those issues, unless you've really addressed it thoroughly, then you've got that load compensation table which has more than eight points. |
| 56:16 | The other one is there are some individual injector trim tables which are a large size injector table, large resolution table I should say, which allows you to trim the injector pulse width for each individual injector. |
| 56:34 | There's some advantages if you're trying to trim around this issue that I've talked about, there are some advantages in doing it in the injector trim tables because doing it in the load compensation table as its name implies, actually is fudging the load calculation value which then influences also other aspects such as our ignition timing. |
| 56:51 | If you do it in the injector pulse width trim tables then it has no effect on the calculated load. |
| 56:59 | Akendo's asked, the learning knock correction table resets automatically when turning off the engine? No it doesn't, it actually does build into a fixed table that stays active so that's actually another aspect, when we are reflashing, you can get caught out by the learned knock values so it's important to actually zero that, so that'll happen every time you reset the ECU, the RomRaider logger actually has a function, a tool for doing that as well and you can also view the learned values for knock control in there as well but if you don't understand that and you don't check that, you can find that you think you're fine, because your ignition timing's a little bit more retarded due to the knock parameter, the learned knock values than what you're actually going to be getting. |
| 57:50 | Kevin has asked, would the load compensation table you talked about be able to do the compensation for large injectors? So I don't think Kevin, you're talking there about the being too rich at idle. |
| 58:03 | You may be able to, again it's not something that I can remember having any real issues with up to 1000 cc injectors anyway. |
| 58:13 | It does allow you to trim the injector pulse width relative to the commanded pulse width so quite possibly, unless there is a hard coded minimum pulse width in which case that may override that so I'm not 100% sure there. |
| 58:26 | Alright team that's brought us to the end of our questions there and remember if you are watching this after this webinar has aired, please ask any additional questions in the forum and I'll be happy to answer them there. |
| 58:35 | Thanks for joining us and hopefully we'll see you again next week. |
Timestamps
0:00 - Intro
1:20 - Reflashing vs live tuning
3:45 - Logging options
6:25 - What you need to reflash a Subaru
7:30 - Available logging parameters
10:40 - External wideband vs factory
14:50 - Subaru factory fuel system design issues
17:05 - Available logging parameters continued
26:30 - Live data vs log to file
28:35 - How to drive the car
31:25 - Interpreting logged data
40:25 - Histograms
51:00 - Questions


