274 | Introduction to Data Analysis
Summary
To become a better driver, get faster lap times and constantly progress your driving skills you’ll need to know how to use a datalogger and understand the information it gives you. In this webinar we will run through what you need to know to get started in data logging for your race day.
| 00:00 | - Hey guys, welcome to RaceCraft's first member's webinar of the year. |
| 00:05 | So if you haven't seen the pre show I just did, I'll just give you a little bit of an introduction of what we're working on today. |
| 00:11 | We're going to be looking at some motorsport data analysis fundamentals. |
| 00:15 | So I'm just going to walk you guys through some of the founding principles, whether that's about selecting a logger, about maybe a little about setting it up and certainly we're going to dive and do quite a lot of basic analysis looking at driver inputs, how to interpret the data, how to make use of some of the tools within the user interface inside the software. |
| 00:35 | So the first thing probably we want to talk about is talking about the different options you've got available when it comes to logging. |
| 00:41 | Now there is a huge range like there are in many parts of the motorsport aftermarket world, whether it's spending as little as $500 USD right up to many many thousands of dollars as far as motorsport logging goes. |
| 00:58 | Motorsport logging is one of those things where I think it's really underrated. |
| 01:01 | There are a lot of people that probably don't feel like they've got the skills or are not really quite sure how to get started and I think that's one of the barriers, along with all of the technical elements when it comes to things like choosing the loggers to actually understand what's going to work for you and what's going to work best for your situation. |
| 01:16 | So you've got, at the base end of the spectrum say in the $500 USD mark you've got basic little units like something like the AiM Sport which is a little usually dash mounted unit, it's about this sort of big, it's made, well I guess its primary function is to work as a GPS based lap timer but some of those models have also got the ability to log extra data from the car so whether that's coming over the CAN bus via the OBDII port. |
| 01:43 | So things like throttle position, brake position depending on the sensors you've already got in your car. |
| 01:50 | It'll also give you live feedback in terms of your reference lap time, your delta to that which we'll get into later in today's webinar as well. |
| 01:58 | But I guess my point I want to make, just a relatively small price point, there's a huge amount of information you can already learn from the car and certainly from your driving. |
| 02:06 | And with those sorts of loggers you've also got the ability to use software to download that data and be able to analyse it in the same way that we'll be going through today. |
| 02:16 | We'll be using a slightly different system but the principles are going to be exactly the same. |
| 02:18 | Then you move up into something more, something like an advanced dash logger which is, I've got an example just here which I'll just bring under the overhead again. |
| 02:27 | So this particular example is MoTeC's C125. |
| 02:30 | It's a really serious piece of kit really. |
| 02:33 | Even though it's I guess aimed at the mid point of the market. |
| 02:38 | So as you see here we've got a full colour screen, we've got a series of LEDs along the top and all of this is super super flexible as far as being fully configurable. |
| 02:48 | This particular model has this AMP style connector on the back. |
| 02:54 | They're also available with an Autosport connector depending on the application that you're using. |
| 03:00 | They've got things like onboard G sensors, huge amount of potential logging capacity, lots of options you can choose from. |
| 03:08 | They can do onboard math, they can do all sorts of clever stuff, whether it's controlling outputs in your car and controlling systems with different logic. |
| 03:16 | So this particular dash is something we're going to be fitting the same model to, we're going to be upgrading the logging system in our RaceCraft GT86 shop car for an earlier model MoTeC that doesn't allow us to do onboard math and that's one of the main reasons we're upgrading to this unit. |
| 03:31 | So that's a really good example of what I would say typically represents a dash logger. |
| 03:37 | Albeit probably at the upper end of the price scale. |
| 03:42 | Then moving on from something like a dash logger, you've got something like a standalone logger which essentially you can treat as a black box. |
| 03:48 | It doesn't have a screen or anything, it's typically bolted in the car in the same way like a power distribution module or an ECU would. |
| 03:57 | It's something that typically tends to be used in really high ends of racing. |
| 04:01 | They've usually got much higher specs, things like the ability to do multiple high frequency signals. |
| 04:09 | So whether it's being able to do things in the thousands of hertz range depending on the systems you're trying to log or having massive configurability or lots of log file capacity, stuff like that so it's something you expect to see in a factory built racecar, whether it's a WRC car or an FIA GT3 or a prototype, these are the kinds of applications you would tend to see a standalone logger attached to the car. |
| 04:30 | You've also got the option in some cases of using an aftermarket ECU. |
| 04:34 | So a lot of aftermarket ECUs these days are including onboard logging as part of them. |
| 04:39 | Probably the biggest restriction with a lot of those is they don't tend to have a lap trigger which is when you're doing motorsport data analysis which is definitely one of the most important metrics we need. |
| 04:50 | We need to be able to automatically trigger lap by lap, whether that's happening from a beacon that we've got set up on the side of the track or whether that's happening by GPS, it's a really important thing to be able to do to understand when each lap's starting and finishing so we can back to back laps and compare them. |
| 05:05 | So that's definitely a restriction to keep in mind if you're planning on using your ECU for your logging analysis. |
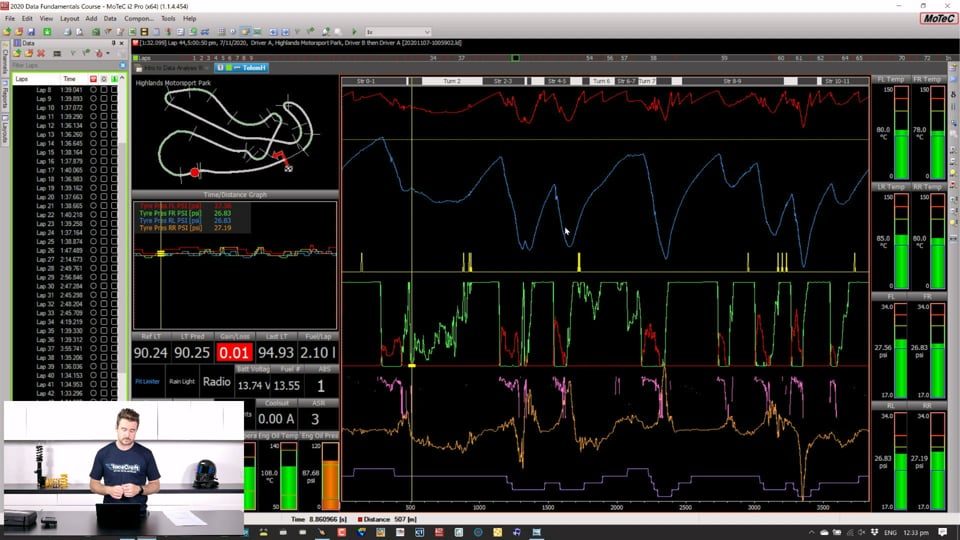
| 05:13 | So I just want to switch across to my laptop screen here, I'm just going to bring up the software I'm going to use for today's demonstration just to give you guys a little bit of a walkthrough of it. |
| 05:24 | So this particular software is MoTeC's i2 software. |
| 05:28 | It's what you'd use if you've got any MoTeC logging product, this is the software that you'd typically use. |
| 05:36 | I'll give you guys, this is what I'm going to do the demonstration on today to give you guys a bit of a walkthrough. |
| 05:40 | And I want to start by just introducing you guys to some of the channels that we might get out of the logger. |
| 05:48 | So I'm just going to create a new worksheet here and I will give you guys a bit more of a tour of the UI once I've got some displays showing up on here. |
| 05:56 | So it's a super flexible piece of software, as we'll see today there's all sorts of displays you can show, all heavily configurable. |
| 06:03 | This is the software that I am quite familiar with, it's what I've used in a lot of my career amongst other different systems but I think it's a really powerful system. |
| 06:13 | Everything we're talking about today is going to be applicable to different systems so it's going to be general, it's not just going to be about MoTeC. |
| 06:20 | So what I'm going to do here is just start with a simple time distance graph and we'll go through what that is a little bit as we go. |
| 06:27 | I'm just going to add a channel here which in this case I'm going to add the core speed which in MoTeC land, this simply means the corrected speed channel. |
| 06:35 | So that's taking, in this case this car's got a wheel speed sensor on all four corners of the car and the software's using some algorithms to get rid of things, well we'll try as much as possible to get rid of things like wheel lockups and wheel slips in the drive wheels. |
| 06:51 | Looking for different conditions and using your algorithms to try and ignore those things to try and give you the best approximation for the car speed that you can. |
| 06:58 | So all of the data I'm going to go through today is just from a race event that we, from a generic GT car just to give you an idea of what it is, there's two drivers that have been involved in it in different skill levels so I will go through that and we'll show you how we do some basic driver analysis of the car. |
| 07:15 | But just, I'm going to build up this basic time/distance plot. |
| 07:20 | So we've got here, I've added the corrected speed channel and along the bottom, we have in this case time, a time axis so this is as the car moves through the lap, as we're getting it into the higher speeds, we end up at the top of the saw tooth and as the car brakes and then goes through corners, we slow down and as the car accelerates again this is the pattern that goes on through the lap. |
| 07:41 | So we've got these sections of the laps here. |
| 07:45 | These are the corners so that mid corner here, this area down here is what, that's giving us the apex of the corner. |
| 07:54 | And these top big peaks here are the top speed that the car's getting to before it brakes for the next corner. |
| 08:02 | So I'm just going to go through and I'll show you guys how you can build up a couple more channels so just by going to the properties here, let's add in a couple more channels. |
| 08:11 | So we'll add in the throttle which is a pretty typical one we'll want to add in so we'll add in throttle pedal, we'll add a brake pressure. |
| 08:23 | We'll use this one here. |
| 08:25 | And I should say as well, as I add the next one, we've got all of the different log channels so all of the channels that we've configured in our logger to log will be available to look at in any time/distance plot like this so in this case if I scan down here, you see these little symbols where this little yellow line is, that's indicating that this was a log channel, that's something that's been measured inside the logger. |
| 08:47 | These little calculator looking symbols are what we call math channels. |
| 08:52 | I'll get into that in a future webinar in a bit more detail but essentially that's taking the logging channels, doing some manipulation on those channels with some math that we defined in our software and then it spits it out as a new channel that we can use that might be more useful to us inside the analysis but that's just what that symbol means but as I scroll down this list, these are all the different channels either I've logged or I've calculated in the background. |
| 09:15 | And by searching through here, this list, so in this case the next one I'm going to add a steering trace, it just narrows down the angle for me here, sorry narrows down the selection for me here to help me see what's going on. |
| 09:28 | I'll also add in a gear channel as well. |
| 09:34 | So if I add those in, now we've got all of those showing so this is showing how the throttle, the brake, the steering and the gear as well as the speed are progressing throughout the lap. |
| 09:45 | This is a pretty typical layout that you might see on an engineer's screen. |
| 09:49 | These are the kind of typical driver channels that we're using a lot of the time when you've got these channels available logged in the car to analyse what's happening both with the car and also what the driver's doing as well. |
| 09:59 | So I'll just add an extra plot in here on the side. |
| 10:05 | We've also got the ability to, actually no I won't, I'll go a little bit more into depth on the time/distance plot before we jump into that. |
| 10:14 | So one of the things that's really important to understand about a time/distance plot is that it's called time/distance because you've got the option to display the X axis as either time or distance. |
| 10:24 | In this case by default it's shown as time, we can see that because the axis along the bottom is showing these time values. |
| 10:32 | We've got the option at the top of the bar here to click this across to distance and now we can see this changes to a distance scale. |
| 10:41 | So this is a really important point that I want to labour on a little bit because that difference between time and distance is really critical to get right when it comes to particularly comparing two different laps to each other. |
| 10:53 | So one of the concepts that is really important to understand is the concept of an overlay so in the left hand side bar here you can see I've got all my different laps laid out here and I've got all the different lap times laid out here. |
| 11:04 | And this red circle indicates the primary lap so the main lap that I want to analyse. |
| 11:10 | So I can do, whether I'm using keyboard shortcuts or click on the laps so I can move between them and what I can also do is add an overlay lap. |
| 11:19 | So in this case I'm going to add a lap from earlier in the racce. |
| 11:23 | So if I click this section here that gives me the main piece of data is showing in colour and the reference set or the set I'm comparing to is shown all in white. |
| 11:33 | So that's what I see in each one of these sections of the plot, we've got now a white section added into it as well. |
| 11:40 | So one of the really important things to understand here is that there is quite a big difference in lap time between these two drivers, we can see the way, just looking at the speed trace you can see the car's being driven quite differently between these two. |
| 11:53 | And the important thing to understand about a time, the difference between looking at it in terms of time or distance, is that if you're looking at the plot in terms of a distance, you're comparing the position of the car in the same position on track. |
| 12:07 | So regardless of if one driver is faster than the other, when we're looking at this data, if we're looking at it on a distance scale it means that the car is at the same position throughout the lap even though it's taking more time to get there, you're comparing the position of the car on track which is usually the most important thing we're looking at, particularly in terms of driver and car performance metrics. |
| 12:28 | You'll also have the option, if I flick back to a time scale here, of looking at it in terms of time. |
| 12:36 | So if we're looking at things in terms of time, now we're comparing all of this data at the same time into the lap as in the time since the car last passed the lap trigger beacon so because we've got a big difference in the time between two drivers here, we can see that, whereas before we had the two speed traces, even though there were differences in them vertically, you could see the shape of them were matching up at, the same features were matching up in the same position on the track because the cars are being driven around the same piece of track, so you're going to expect even if the differences in how well the car's being driven vertically, you're going to see the car following the same features. |
| 13:10 | In this case we see an offset developing which at the start of the lap when the performance is quite similar, these features for when they get on the brakes are quite similar, even through turn one which is a really long turn at this track which is why you see this big plateau here, it's relatively similar. |
| 13:24 | And then as the white driver loses time, we see all of these features are slowly slipping and that slip is getting further and further and further into the lap. |
| 13:31 | So this makes it really difficult if not impossible to make any meaningful driving analysis between these two drivers because what we want to compare is what you were doing at this point on track, not when you were doing it. |
| 13:44 | So we'll almost always, I'm just going to flick this back to our distance plot. |
| 13:48 | We'll almost always be comparing these things in terms of lap distance. |
| 13:53 | There are certainly times when the time scale is relevant. |
| 13:56 | Usually it's often looking at reliability or powertrain metric, much more so than actual driver analysis. |
| 14:04 | So I just want to give you guys a little bit more of a walkthrough of the UI here. |
| 14:07 | So we've got the ability to zoom, so if I pick a particular part on track, I can zoom in and out like this by going up and down on the keyboard. |
| 14:18 | If I want to look at a certain spot on track, I've got shortcuts. |
| 14:21 | In this case in MoTeC's i2 it's W for zoom back to a full lap. |
| 14:24 | I can also double click and highlight a certain piece of track to look at it in more detail. |
| 14:29 | Obviously if I hover the cursor over, I can drag this along with my mouse and we see the value in the top left of each legend here on the screen. |
| 14:40 | As I drag this through we can see these values given to us live, both for the primary which is the main piece of data and also the white which is the overlay. |
| 14:50 | And really handy sometimes as well is it's giving you, in addition to giving you the values, it'll give you the difference between them. |
| 14:58 | So we can see at this point here we've got basically full throttle on the main piece of data, only 83% on the overlay and that's a 17% difference, it just stops you having to do that math in your head all the time. |
| 15:11 | You've also got the option of showing some statistics which I've just brought up in the top right here. |
| 15:18 | So what that's showing us is some basic statistics for what we've got showing on the screen at the moment. |
| 15:23 | So if I just zoom back out to a full lap, we can see for the main piece of data, this little symbol here means minimum, so the lowest speed on track was 54, the maximum was 241 and the average was 149 and it's the same statistics computed for the overlay as well. |
| 15:38 | So often if you're interested in looking at a maximum or minimum you can either look at it at a whole race. |
| 15:43 | So by pressing F2 I can zoom out to the whole race or by pressing W I can just skip back to a whole lap. |
| 15:49 | So depending on the things you're interested in, using these little tools can really save you a lot of time if you're looking for an average or a maximum or minimum, particularly in terms of reliability channels, it can be a really useful way of looking at things. |
| 16:03 | Some of the other things I wanted to point out which is typical to most data analysis packages is the position of the cursor on the screen will usually give you some basic readouts of what's happening at the bottom or somewhere it'll be shown on the screen so in this case I've got where I position the cursor, so just to be clear about that I'm talking about down here. |
| 16:25 | I've got the time reading out and the distance and the really trick thing about that is if I want to compare two things, so in this case I'm going to zoom to this section of the track, I've got the throttle position here, I've got the faster driver is staying on the throttle for longer, the slower driver is lifting off so if I just position the cursor where the slower driver is starting to lift off, press space bar, and come across it gives me a second cursor that comes up, that gives me the ability to measure between those two points and where that's shown is down here in the bottom. |
| 16:58 | So it's showing me there are 0.3 seconds difference between those two events happening and that there are 23 metres of difference so that means that the pro driver in this case is going 23 metres later into the turn than the amateur driver is which is a really good way of being able to communicate that when you're talking about differences between drivers and you're trying to help one driver with their driving relative to your faster driver. |
| 17:24 | Of course video also comes into this, it's a really useful tool but particularly when you don't have video, being able to read the distance out in terms of that, it gives them a relative change, particularly into something like a braking zone there's usually number boards on the side of the track so they can relate that distance you give them about how much deeper they need to go or what they need to do at a different position on track, that gives them a relative reference for how far they need to move along. |
| 17:53 | So that is the basics of the delta function. |
| 17:57 | We've also got, I want to dig in a little bit into how the overlays work here. |
| 18:02 | As we move through the lap, we've got the ability to look at the way the throttle is being used, the way the brake's being used, and we can see really clearly, differences in technique. |
| 18:14 | So if I just skip forward a little bit here, I'm just going to go to a really obvious part so here, we've got it's really obvious the pro driver is using a lot more brake pressure than the amateur driver. |
| 18:23 | Obviously the way they're ramping that up is much more aggressive, their peak's much higher, whereas you've got the amateur driver here being quite a lot slower, getting to their peak pressure and a little bit different in their release behaviour as well. |
| 18:37 | We'll dig into that a little bit later into the webinar. |
| 18:39 | So one of the things in addition to performance aspects which is one of the things we're often really concentrating on in terms of motorsport data analysis, the other one is reliability so obviously if you've got a reliability problem it doesn't really matter how fast you're driving, how good your driver is, how great your setup is, if you've got a reliability problem, whether it's in the powertrain or tyre pressures or anything like that, that's going to stop you maximising your performance before you even get the chance to. |
| 19:07 | So looking at reliability metrics is one of the main things you need to start with when looking at your data analysis, it's the primary thing you need to take care of before you get look at the performance and I want to show you guys a couple of ways we can make use of a typical data analysis package to make sure that everything's safe in the car. |
| 19:25 | So I'm going to open a new worksheet here. |
| 19:29 | And the first thing I want to start with is looking at a time/distance plot in a similar way to what we did with the driver performance metrics. |
| 19:35 | So I'm just going to add a time/distance plot here and let's add some engine parameters so I'm going to put engine oil temp, add another one for engine oil pressure and let's see what other temperature channels we've got here that we might want to put in, we have coolant temperature for example. |
| 19:55 | So I'm just going to zoom out to a full lap and I'm going to get rid of the overlay for now, just look at this main lap. |
| 20:03 | Sorry if I zoom out to a full race distance, we can see the evolution in how these temperatures are changing throughout a race so at the top here we've got our engine oil temperature, our engine oil pressure and our coolant temperature. |
| 20:15 | Now we can see straight away that there are some big differences in the trends that are happening over the race and that's one of the really important things to understand about zooming over a whole race is it really gives you a good understanding of the trends that are happening. |
| 20:28 | Are things slowly getting hotter or colder over a race, have you got dips anywhere, interesting features and one of the things I quite often like to do when I'm looking at a time distance plot for reliability channels, is actually add the speed channel in there because it gives you a lot more context about what was happening at that point on track. |
| 20:42 | I'll show you what I mean by that, if I add the corrected speed again, and I usually just put that at the top. |
| 20:53 | So we'll add, move the group up as well, just so that's really clear. |
| 21:01 | So we can see here as the car moves through the race, this is quite a long race, in this case it's about a three hour race, we can see all of the features, you can sort of see those patterns as the car moves through the lap, you can see the patterns repeating over and over and over again. |
| 21:15 | So you can sort of see each lap in addition to each one of these little red lines which indicates a lap. |
| 21:21 | But we see this trend in the coolant temperature, there's something different, really different happening, same in the oil pressure and actually same in the oil temperature as well. |
| 21:28 | You can see that same feature, something changing in the middle of the race. |
| 21:30 | We can see here, in the speed trace it gives us a lot of information about what's happening, in this case it looks like a safety car period where all the cars slow down on track so they can clear and accident or a car that's not running anymore and the cars all need to drive around slowly for a while before they restart the race in order to collect that car off track so that's what's happening here so again you can just see how that speed trace gives you a lot more context. |
| 21:51 | We can also see these dips that are happening in the race, in this case we can see the car's coming to a stop and this means for us, this is during a pitstop so we can see the car doing its last in lap, we can see this constant speed which is when the car is in the pit lane on its pit limiter travelling at a constant speed, stopping in the box and then taking off again and continuing on for the rest of the race. |
| 22:13 | So for me that speed trace really tends to give you a lot of useful information. |
| 22:19 | Now there are limitations to using a time/distance plot, when looking for reliability. |
| 22:23 | If you're looking for reliability issues whether it's spikes or differences or maximum/minimums and averages, it can mean, when you look over the whole race distance like this, there's often small features that you don't pick up because they're just too small. |
| 22:34 | Especially if the car's been on track for quite a long run. |
| 22:36 | The other option is to go through lap by lap which is incredibly time consuming. |
| 22:40 | So in this case I've just zoomed to a particular lap early in the race and I can use, there's lots of different shortcuts, every different software will have different shortcuts. |
| 22:49 | For MoTeC's i2 it's N for next lap. |
| 22:51 | So I press N, N, N, N, N and you can see down the side here the selection of the lap is moving down as I go next lap it's going to the next lap. |
| 23:00 | So you can see how going through lap by lap, especially a long race, it's a really tedious experience. |
| 23:06 | I'm going through lap, lap, lap, lap, lap. |
| 23:08 | If you're looking for a spike or a minimum or an average or something, this is going to take you a long time, particularly when you look through, I'm only looking through a couple of really basic engine parameters here, by the time you're looking for EGTs and lambdas, diff temperature, coolant pressure, whatever you're looking for, it's a really time consuming process. |
| 23:26 | There is absolutely a value in using a time/distance plot but I'll come back to that in a little bit. |
| 23:32 | First I want to talk about another tool we can use to understand these parameters and that's a channel report. |
| 23:39 | So I'm just going to add one of these underneath and give us a chance to compare them. |
| 23:41 | So if I go to the UI here and add in a channel report. |
| 23:49 | Now we've got the option down in the bottom of this particular software, we can add the channels that we want to report on. |
| 23:56 | So it'll become clearer once I make it what this is. |
| 23:59 | So I'm just going to add the same channels that we've got shown in our time/distance plot. |
| 24:02 | So we're going to put our engine oil temp and our engine oil pressure. |
| 24:10 | Sorry I pressed the wrong button there to get out of that, let's try that again. |
| 24:14 | Engine oil temp. |
| 24:17 | Engine oil pressure. |
| 24:19 | And we'll also add in our coolant temp. |
| 24:23 | Now we've got the option here to have the software automatically calculate all the different statistics for this channel. |
| 24:32 | So we've got minimums, maximum, the ranges which is how much it changes over a certain time period. |
| 24:38 | Averages, absolute values, start, ends, change, standard deviations, all sorts of different things. |
| 24:44 | And all these tools are there to help crunch the numbers for you and make your job a lot quicker by not having to look through all of these things manually. |
| 24:50 | So let's select some statistics to automatically calculate these things for us. |
| 24:54 | So for the engine oil temp one of the things we'd often be interested in is the maximum obviously, we want to know when and where that happened and what it was. |
| 25:02 | For the engine oil pressure we'd often be interested in the minimum, let's for argument's sake, let's say we're also interested in the average. |
| 25:09 | And the coolant temperature let's say we want the maximum and the minimum. |
| 25:13 | So I'll press OK. |
| 25:15 | Now straight away that doesn't look quite right, we're only showing it for the selected lap so I'll just go back into the configuration and change it for everything we see. |
| 25:24 | That makes a bit more sense so if I just bring this out like this. |
| 25:27 | What we've got here, I'll just explain what we're actually seeing. |
| 25:32 | So we've got a table here and along the top here each one of these columns is a different lap that we're looking at throughout the race. |
| 25:39 | And we see their laps times are associated and these lap times match up with what we see in the lap selection column here as well. |
| 25:45 | And then on the other axis we've got our channels we're reporting on and whether it's a maximum, just in this section here it shows us whether it's the maximum, minimum, the average. |
| 25:56 | One of the other functions that's really useful is we've got the option to do some automatic highlighting. |
| 26:02 | So in this case, this is user configurable, but in this case by default it will show minimums with blue and maximums with red. |
| 26:09 | And on the scale here at the bottom we can scan through the whole race and we can see those maximum and minimums being highlighted for us. |
| 26:16 | In the same way, exactly the same information is being reported on here in a little report graph so exactly the same values that are shown in this table are reported on here. |
| 26:26 | So we've got our maximum oil temp, we've got our oil pressure evolving throughout the race and we've got our maximum and minimum coolant temperature evolving throughout the race. |
| 26:39 | So one of the beauties of using a channel report like this is that it allows you to see what's happening sort of from a bird's eye view without having to dig into the detail of a lap by lap analysis. |
| 26:49 | So we can see here, different spikes and different features in the same way that we saw by looking at the main data. |
| 26:56 | So if I just go back to the full race you can see some of the features being replicated there but let's say there's a feature we're interested in, let's say we're interested in this oil pressure dip that's shown here, if I click on that at this point in the graph, it tells us it's lap 48. |
| 27:14 | Now if I want to go to lap 48 on here, there's lots of different ways I can do that but in MoTeC's i2, if I just zoom in a little bit further. |
| 27:24 | Sorry that's not right, that's lap 44, sorry I have got the right lap by mistake. |
| 27:31 | I thought I had the wrong one, I've got the right one. |
| 27:33 | So this is giving us an opportunity to dig into that in more detail. |
| 27:38 | So the point I'm trying to make is we've seen an anomaly, something we're not quite sure what's going on in the channel report which is again just giving us that bird's eye view. |
| 27:48 | We can quickly scan the channel report, if we see anything we're not sure about, that's the point where you use something like a time/distance plot to dig into the detail of what's happening. |
| 27:57 | So if we want to look at the oil pressure, in this case it's fine, there's nothing else going on but if we wanted to compare it to another lap where something was fine, again we could bring up a reference and we could just see the difference in the different lines and how the oil pressure was evolving throughout the lap. |
| 28:11 | So in this particular case there's nothing actually wrong with what we see, I just wanted to show you guys how you can make use of something like a channel report to really cut down the time, particularly when it comes to things like reliability channels, there's definitely performance applications you can use them for as well, particularly when you get into heavy math channels and stuff but particularly from a performance perspective, making use of channel reports is a massive time saver when you're on track. |
| 28:35 | So the next thing I wanted to show you guys is discussing the time variance channel which is something we use a lot, particularly from a performance perspective in motorsport data analysis. |
| 28:46 | So again back over on my laptop screen, we've got our same channels I built up for you guys before in the time/distance plot. |
| 28:53 | If we want to compare the performance of two different laps, one of the ways, one of the obvious ways, if I turn the overlay back on, we can do that is by looking at the difference in this case in the speed trace. |
| 29:04 | So the way I normally configure this, I'll just tweak this a little bit further. |
| 29:07 | The UIs are usually quite configurable, you can modify things and overlay things as much as you like, I usually make the speed trace a little bit larger, just to give myself, so I can see a little bit more detail, because it's one of the primary metrics which is obviously controlling our performance on track. |
| 29:22 | I've got, I can see these really clear differences in the speed which are obviously going to be making massive differences in the lap time. |
| 29:29 | We can see here there's a big loss, we can see here there's a big loss. |
| 29:32 | We can see here there's a big loss. |
| 29:35 | One of the other ways to visualise that that's really useful is by looking at something they call the time variance, which is often also referred to as a delta function so every software package, every modern software package certainly includes this. |
| 29:47 | In MoTeC you can press F3 to bring it up but there's also a button along the top you can use to bring up the time variance as well. |
| 29:56 | Essentially what this is showing us is how much time slip we have along the lap. |
| 30:00 | So the places where the time variance is changing the most are the places where the most difference is between those laps, those are the times when the differences between those two laps are the most. |
| 30:11 | So what I mean by that is if we look at this section of track here where we've got the coloured driver compared to the white driver having a massive difference in their performance. |
| 30:20 | We can see the time variance has this big spike. |
| 30:22 | So this big change in gradient is indicating there's a big time loss happening for the reference driver. |
| 30:28 | And we can see how it sort of evolves throughout the lap. |
| 30:31 | We've got some steady losses happening as we move throughout the lap but we have got these dips happening which are indicating our biggest losses, the ones that we want to attack first. |
| 30:40 | So the way we use the time variance channel is usually by saying, OK we've got a difference between either two setups on the car or between two different drivers or between the same driver and looking at one day to the other. |
| 30:53 | Or maybe some different driving styles or different ways you're driving the course, you can see, you want to look for these biggest spikes in the time variance. |
| 31:01 | These are giving us the low hanging fruit, the parts we want to attack first and really it's a case of, with motorsport data analysis, there's never enough time to attack everything, it's usually a case of going through and attacking a few, maybe two or three positions of a track rather than trying to fix everything at once, it's just not doable, you want to look for the biggest losses first and attack those first. |
| 31:22 | So in this particular case, it's indicating in this particular track is turn one is a big loss, there's another decent sized spike here through a really fast section of the track which in this particular track is a really high speed corner which should be almost flat through there. |
| 31:41 | And then later in the lap we've got this spike and I'll come back and we'll actually dig into more of that data a little bit later. |
| 31:46 | I just want to go through a couple more things and we'll come back and dig into some of the actual data and look at the reasons why we've got some of those performance losses. |
| 31:57 | This is a really good place to mention in the webinar that if you guys have got any questions about anything you've seen so far, chuck those in the chat and Luke will chuck those through to me and after I've gone through this last part of the demonstration, I will get into some live Q&A and hopefully you guys have had some questions that have come up throughout the webinar. |
| 32:18 | So as far as using the time/distance plot to actually understand these differences, let's take this difference at turn one which is a really obvious example, so I'm just going to zoom into this part of the track. |
| 32:29 | So I'm just going to get rid of the variance channel for a sec just to make the displays a little bit bigger. |
| 32:34 | As we see we looked at actually earlier in the webinar, we've got the first thing that stands out to us is how much earlier one driver is lifting off the throttle compared to the other and again we can use that delta function, so if I use the space bar at the point where he's lifting versus the other one, we see down here it's about 20 metres. |
| 32:52 | So one driver is lifting about 20 metres later than the other which is obviously going to give us a pretty big difference in the speed trace. |
| 33:00 | The other really interesting thing here is actually the braking position where one driver is pressing the brakes compared to the other isn't actually that different but the brake pressure is quite different. |
| 33:11 | So in this case we've got the slower driver which is shown in the white lines, is using more pressure initially so they're actually slowing the car more heavily and in this particular part of the track, with this particular car, you don't actually need a massive braking event there, he's over slowing the car here and that's what's happening with this big, if we line these two points up on the map, we can see this extra brake pressure is really over slowing the car which is one of the things that's contributing to the difference in pace. |
| 33:41 | We also see something a little bit worrying, this is a bit of an unusual corner and it's two corners quite close to each other but it's a little bit worrying that he's coming all the way off, essentially all the way off the brake and then coming on with one big stab again at the end where the pro driver in this case is using a little bit more consistent, this isn't a particularly typical style of brake trace because it's these fast bus stop corners that are quite close to each other that are coming onto a long corner following but you can see nonetheless that the braking technique difference between these two drivers is really different. |
| 34:13 | Also the way, if we look back up to the exit of the corner. |
| 34:16 | So their white driver here has lost a whole lot of time on corner entry and by the time they start settling into this corner and they're coming back onto the throttle, they're doing that quite a lot later and we also see, this particular corner's a long 180° corner and we can see the driver that's driving with the white lines is really stabbing quite aggressively on the throttle. |
| 34:38 | So as they're going through that corner they're realising that they're too slow in the corner, they know it, we've probably already talked about it in a previous session, they've got it in their head that they're trying to work on that but they're giving these stabs on the throttle and this is really not a great approach. |
| 34:51 | You'll often see a lot of unsteadiness throughout the section, both the drivers there's a lot of unsteadiness on the pedal, there's always bumps in the track, you're never able to be perfectly smooth on the pedals but these stabs we're seeing here, these positions here and here and this one as well, these are a really bad sign in terms of unsettling the car. |
| 35:13 | So if the car was actually closer to the limit, if he was driving it in a way, more like the colour driver here, that would be almost certainly unsettling the car enough to cause it to lose control. |
| 35:24 | So that's straight away a technique problem we see in the car. |
| 35:28 | Now if we zoom back out to the whole lap, and we'll bring up our variance channel again just to make the point. |
| 35:33 | So we've got this section up here we want to analyse, we've got this relatively steep dip, now if I just zoom back in here. |
| 35:42 | So there's a couple of obvious things going on here in the differences in the speed trace. |
| 35:47 | We can see in this particular part of the track. |
| 35:50 | And I can actually bring up a track map for you to make it a bit more obvious. |
| 35:53 | So this is the car is coming up and going through this fast left hand corner which is happening up at this point up here. |
| 36:03 | We can see as I move the cursor, the little dot moves on the track map there. |
| 36:07 | In this case the colour driver is staying on the throttle which is shown, and this is the part I'm looking at here. |
| 36:16 | Is staying on the throttle much longer whereas the white driver is completely lifting off the throttle and coasting through this section. |
| 36:21 | This is something you'll often see in the difference, particularly in high speed corners, between two drivers that are quite different skill levels. |
| 36:27 | You've got one driver that's quite scared and is lifting off the throttle and the other driver which is getting back, staying on full throttle longer and as a result that's why we see this big difference in the speed trace here which again if I bring the variance back in, we can see that's the start point of where these two speed traces start to diverge, is the point where the variance starts to creep up as well. |
| 36:50 | So that is a really basic look through of how you would go through and do a driver analysis using some logged data. |
| 37:03 | That where I'm going to leave it here for the lesson part of today's webinar. |
| 37:07 | We will be coming back and doing some more, the next following webinars after this are going to also be on motorsport data analysis. |
| 37:14 | But for now I'm going to jump across to the questions and I'll start going through some of those. |
| 37:22 | One thing to remember is that we've got our courses, so as I mentioned before we've got our Advanced Data Analysis course coming out soon and if you're not already looking at our Data Analysis Fundamentals course, which covers a lot of what I've gone through today but also a whole lot more, a lot of detail about choosing loggers, a lot of detail about driver analysis, how to set up and configure your loggers and a really great 6 step process to help you work through that. |
| 37:50 | If you're interested in this stuff, you should definitely go check that out if you're not already on that course. |
| 37:55 | And remember also if you are a RaceCraft gold member, if you're not watching this live, you can always jump across to our forum and if you've got questions that have come up from watching today's video, you can also always jump onto the forum and I'll be there answering questions along with a whole lot of other experts and the rest of our RaceCraft community. |
| 38:16 | So I will jump across now to the questions and answers and see what we've got, what you guys have asked, OK, so Jackson has asked, could you please recover the difference between the time and distance plot. |
| 38:30 | OK yeah so what Jackson's asking there is talking about when I described the difference between looking at a time scale or a distance scale along a time/distance axis so if we're looking on a time scale, it's measuring the position of the cursor as I'm looking at that position on track, it's looking at how long into that lap something occurred. |
| 38:51 | So it's the time since we passed the last lap beacon or we started this current lap. |
| 38:55 | If I look at it on a distance scale it's how far the car has gone. |
| 38:59 | So most of the time in performance, when we're looking at performance aspects, whether it's to do with chassis performance, or whether it's to do with the way the driver's driving the car, we're almost always looking at things from a distance perspective, we want to compare what the driver was doing at that position on track compared to the other driver. |
| 39:16 | We're not usually interested so much in the time because there's always a time difference between them and because those two events happened at a different time into the lap, not a different distance, it makes it much more difficult to overlay things and get anything useful out of it. |
| 39:30 | So when it comes to performance aspects you're almost always looking at the distance scale. |
| 39:35 | I would say have a play around, if you can get a chance to play around with some data analysis software, most of the manufacturers of data analysis systems give away their software for free and it's usually pretty easy to get some example data either from the manufacturer themselves or that you can find online and have a play around with it yourself. |
| 39:53 | That's the best way to really get a good handle on that. |
| 39:55 | I know that when people are starting out with motorsport data analysis, sometimes it can be a little bit confusing and just actually playing around with the data yourself and flicking between the time and distance scales is the best way to understand that for yourself. |
| 40:06 | OK Miles is asking, is damping analysis a part of the fundamentals course? No Miles we don't actually, well we do discuss, yeah let me back track on that a little, damper analysis is discussed in the fundamentals course as far as talking about an introduction to it, saying the damper potentiometers, this is how they work, this is why we use them but we don't really dive into any of the analysis on that. |
| 40:30 | That's saved for the advanced course where we really get into using that stuff for understanding, I guess the reason we're saving it for the advanced course, it's not typically a sensor that you are using for when you're at an entry level, maybe you've just bought your first logger or you're just doing a casual bit of racing on the weekend, you don't typically have damper sensors on the car, it's a lot more overhead, it's a lot more expense, there's a bit more overhead involved with setting them up and calibrating them and stuff. |
| 40:58 | It's not something you tend to have at the entry level but as you're moving on and want to understand more things about both your damping and your chassis and your ride height, it's a really useful thing. |
| 41:07 | The advanced course goes through actual damping histograms, understanding bump and rebound settings, the implications it's going to have on the car, how you can use the damper position sensors to understand suspension stiffness differences and the what you expect to see based on different adjustments to the car, so there's quite a lot of information that's going to be going in the advanced course. |
| 41:27 | It's not in the fundamentals course because we don't think it fits very well with the people that are just starting out in their analysis. |
| 41:34 | Flynn has asked, how do you deal with pitstops affecting the channel reports when they're giving you bad values? Yeah so what Flynn's asking there is, when we went through those channel report example I did in the webinar, you've got these sections of data where you might have a minimum, let's say you might have a minimum oil pressure, now if that minimum oil pressure happens during a pitstop because let's say the engine is switched off during the pitstop, then that's going to give you an erroneous value. |
| 42:02 | Let's say if the engine's switched off obviously you're going to have zero oil pressure, the sensor's value drops to zero, when you're scanning through that channel report obviously the minimum value you're going to have throughout that log file is a zero. |
| 42:12 | We don't care that we've had a zero during the pitstop, we're interested in the minimum oil pressure that we've had somewhere on track. |
| 42:21 | So there's lot of ways you can deal with that whether it's, there's some different analysis systems have different ways of what we call cleansing the data. |
| 42:27 | So one of the ways that MoTeC does it is they call them untrusted laps, so laps where they've either been a lot slower than the fastest lap time or where you've clearly entered the pit lane or something like that. |
| 42:37 | These are often what we refer to as untrusted laps, we don't want to usually, for some cases we don't want to include them in all of our analysis so you can use the algorithms built into the software to help cleanse that out which in that case would mean it would ignore the oil pressure when the car was in the pit lane and only look at it when the car was on track and that way that highlighting function that we've got in the channel report would come back into play and be useful for us. |
| 42:59 | Now that little blue highlight is going to show us the minimum oil pressure we had on track rather than the pit lane because in the pit lane, we don't care about it, we actually want to look at what the minimum was on track. |
| 43:09 | The other way to deal with that is by using math channels. |
| 43:11 | So you can cleanse the data with your own custom conditions whether it's by looking at when the car is in the pit lane or sometimes you're only interested in laps within a certain percentage of your fastest lap or whatever it is, you've got an enormous capability to customise the channels and then you can take those customised channels that you've defined with math and report on those rather than the log channels and that's something we'll get into in some of the future member's webinars going through how to define some of those math channels and how you can make the best use of them. |
| 43:40 | So hopefully that answered your question Flynn. |
| 43:43 | Elijah, could you clarify the difference between logged and telemetry data? Yeah no problem, so the difference between, Elijah's asking, the difference between logged and telemetry data, logged data is what we have when we've got an actual logger in the car. |
| 43:57 | This is recording every sensor that's running to this, whether it's physically connected to it with a wire or whether it's getting it over a CAN bus, everything that is going inside the logger is being recorded inside its little chip inside. |
| 44:08 | And when the car comes into the pit lane, we usually take our download cable and plug into it and we pull all of the data from that, since the last time the car was run on track, will be uploaded to our laptop or our server or whatever system you've got on track. |
| 44:23 | So that's the logged data. |
| 44:24 | The telemetry data, the convention for describing it in a motorsport context is that the telemetry data is coming live either over a radio frequency or often these days over the cellular network so the 4G or I'm sure in the future the 5G network. |
| 44:39 | So that means it's as simple as having essentially like a modem, a cellular modem in the car and a cellular modem in the pits and you've got live data coming from the car back to your, that you can watch on track, sorry you can watch on your screen live as the car moves aroud the track. |
| 44:54 | So often you're looking at reliability stuff. |
| 44:56 | You're definitely looking at some performance stuff so you can do live driver coaching by doing live overlays with what's happening on track at the moment compared to what your fastest lap was or any other lap that you're interested in. |
| 45:08 | So you can coach the driver through it, whether it's settings on the car or driving technique. |
| 45:11 | You can also, you're obviously always looking out for reliability issues and settings on the cars that you're using on the telemetry. |
| 45:18 | The stuff that you're sending over telemetry and the stuff that you're logging inside the logger, it's actually all the same data. |
| 45:23 | The source of it's all the same, it's all coming from the same sensors on the cars, usually the biggest difference is the stuff we're sending over telemetry is usually a bit more stripped down. |
| 45:31 | So typically we don't tend to send everything that's been recorded by the logger over telemetry as well, we're usually only sending the bare minimum that we know we're going to need during the race and usually we're sending that stuff at a much lower frequency. |
| 45:45 | And the reason is you're usually bandwidth limited. |
| 45:47 | So regardless whether you're using cellular or radio frequency to send that data over telemetry, there's always a limit on the bandwidth, there's only so much bandwidth you can use. |
| 46:00 | I think as we see motorsport 5G telemetry come on board, that may well change. |
| 46:06 | The potential difference particularly at tracks with good coverage, we may well see us being able to send a full set of equivalent log data over telemetry and it may even get to the point where we don't even need to download the cars because we're able to get it all real time and able to use that for our analysis without even needing the logged data. |
| 46:25 | We're probably still a wee while away from being exactly at that because often racetracks are at places where you don't necessarily have great coverage. |
| 46:32 | Obviously there's still going to be value for a long time in plugging into the car and getting that really high frequency high quality data. |
| 46:40 | But I think we will start to see an evolution as 5G coverage rolls out and as it becomes more available at race circuits, I think we'll get to the position where the difference between the telemetry and the log data will be almost indistinguishable. |
| 46:55 | Jason is asking, can you talk about some typical screen layouts for data analysis? Yeah sure no problem Jason so if I head back over to my laptop screen here. |
| 47:08 | So what Jason's asking is how do you lay out your data analysis package? Today I've really only gone through the time/distance plot and channel report, I haven't really gotten to any other displays, I'll definitely be going into that in a future webinar, diving into the different types of displays we've got but if I've got an example here of a typical display that I would use myself during a race weekend if I just skip back out to a full lap view. |
| 47:32 | So obviously we've got our time distance plot that we're already familiar with. |
| 47:36 | We've got our track map here, so as I move throughout the lap we've got the cursor moving around the track which just helps us orientate where we are on track. |
| 47:44 | In this particular situation I've got my tyre pressures showing up here as well so I can track how those are evolving throughout the race and throughout the lap. |
| 47:51 | I've got some basic stuff about car settings whether it's about whether the pit limiter's on, the rain light's on, if the radio is being switched on or off which can be a good diagnosis thing if you're having communications with your driver you can see if they're flicking the radio button on and off. |
| 48:04 | Got our traction control ABS settings, some basic reliability stuff. |
| 48:08 | So engine oil temperatures, pressures, fuel pressure, stuff like that. |
| 48:13 | And this is a typical layout that I would have when I was watching the telemetry live. |
| 48:17 | Obviously if I'm going through post session I'll be looking at lateral and longitudinal G force diagrams, I'll be looking at the tyre pressures in more detail, we'll go through all of that stuff more in future webinars but there's an enormous amount, there's lots of different ways you can lay out your log data but this is typically how I look at it. |
| 48:36 | There's also a couple of extra channels that we've got showing on here. |
| 48:39 | If I just press, so if I bring up the legend, it'll just make it a little more obvious what we've got here. |
| 48:44 | So these are all obviously colour coded. |
| 48:46 | I've got engine RPM, the speed that we've already looked through, I've got a setting for when the traction control is active. |
| 48:52 | I've got the throttle and the brake overlaid with each other which I like to do because you're usually only using the throttle or the brake once at a time, you're not usually using both. |
| 49:03 | The advantage in that, if I overlay them, allows me to save some screen space and I can make all of the other displays a little bit bigger as a result which I find an advantage to see more detail. |
| 49:11 | I've got some information about brake bias here, so I'm looking, often in motorsport you've got the option to change the brake bias on the go in the car. |
| 49:18 | So that just gives me a way to compare the different brake biases the drivers will be using. |
| 49:23 | We've got our steering input here and our gears exactly like we had when we went through the example before so that's how, a typical way of how I have my telemetry laid out. |
| 49:33 | In future webinars we'll go through some different layouts for different types of particularly chassis analysis. |
| 49:39 | So we've got our last question here from Will, what are your thoughts on the AiM Solo 2 DL? So yeah the AiM Solo is a great little product, it's something that's more or less what I was describing at the top of the show talking about really basic, more entry level loggers. |
| 49:58 | So that's something, it's a little self contained unit, it's got a little screen on the front of it, it's got the ability to not only act as a lap timer and give you that time delta, so that variance plot that we looked at, that time delta or time variance plot that we looked at during some of the analysis I was going through, that data is also available live to the driver so that's something I really should have talked about earlier on as well where you've got the ability to see whether you're doing better or worse than the reference lap time and rather than being shown as a plot like we had it in the time variance, it's being shown as a number. |
| 50:29 | So whether you're above or under the number, anyone who's done a little bit of sim racing, whether it's iRacing or Asetto Corsa or something like that, will probably already been familiar with the concept of time variance you can see whether you're gaining or losing time relative to your fastest time, it's the same idea that's able to be shown on something like the AiM Solo that's a really great advantage, really great driving tool. |
| 50:50 | You'll also have the ability on the DL model to input vehicle data. |
| 50:54 | So in addition to having all of that awesome logged data you've already got with the inbuilt accelerometer and the time/distance plot all of that stuff you can do, you can also if you've got the ability to pull it out of the car from the CAN bus, you can also do the accelerator and brake and steering or anything else you've got available depending on your car and what's available. |
| 51:15 | So it's definitely a lot of really great value for money. |
| 51:18 | As far as an entry level kit it's a really low overhead to fit and maintain, it's definitely one of those units that's a great entry level unit. |
| 51:28 | So guys that's all I've got for today, there's no more questions there so that's all I've got for today's webinar, there were some really great questions there. |
| 51:35 | I hope you guys learned a lot out of it and I will see you guys in the next webinar which will also be on data analysis where we will dig in a little further, thanks guys. |
Timestamps
0:00 - Intro
0:35 - Logging options
1:15 - Dash mounted unit
2:15 - Advanced dash logger
3:40 - Standalone logger
5:10 - Adding channels
10:05 - Time or distance on the X axis?
14:05 - Manipulating data
16:00 - Analysing differences between drivers at a specific point
17:55 - Overlays
18:40 - Reliability metrics
23:30 - Channel report
28:35 - Time variance channel
32:15 - Further driver analysis
38:25 - Questions