286 | How To Analyse Braking Data
Summary
Braking is one of the most critical parts of your car to get right to improve your performance. In this webinar we’ll take a look at what brake data you’ll typically use and how to get the most out of it.
| 00:00 | - Hey team, welcome to today's member's webinar. |
| 00:02 | The topic today is all about braking systems data analysis. |
| 00:06 | Specifically we're really going to be focusing mostly on brake pressure sensors but I'll also touch on some other ones as well. |
| 00:13 | So for a start, let's talk about why we have brake pressure sensors in the first place. |
| 00:17 | So really using brake pressure is really I guess the most convenient way of measuring the braking effort that the driver's putting into the car. |
| 00:25 | So the way we're doing this is we're plumbing sensors into the hydraulics of the brake system so that means somewhere after the master cylinder but before the brake callipers and the idea here is that we can get some sort of measure or relative measure of the amount of effort the driver's putting into the braking system which is important both from, well certainly from a driving analysis perspective, understanding where someone's braking on track, understanding how hard and how they're modulating that brake pressure as they move throughout the circuit but also from a performance perspective from the vehicle's perspective. |
| 00:56 | So we can look at how effective the brakes are, we can look at things like brake pressure efficiency which is dividing the coefficient of friction by the pressure that we're getting, things like that. |
| 01:06 | There's lots of different uses we can use the brake pressure for. |
| 01:08 | Obviously brake bias is another one we'll get into a bit later in the webinar as well which is a really important part of any vehicle analysis. |
| 01:15 | If we just jump over to the overhead camera here I've got an example of a pressure sensor. |
| 01:19 | Now this particular pressure sensor, it is not designed to measure brake pressure but in form it's really really similar to exactly what you'd see for a brake pressure sensor and what I mean by that is it's the same as far as it's got a, this particular one has a tapered pipe thread on the end, it's got an inlet on the end to interface with the fluid and then we've got a 3 pin plug on the back so you're going to have a positive voltage, a sensor ground and also one of those pins will be for the sensor output as well. |
| 01:50 | Most often there's a 0-5 volt style sensor, this particular one is for much much lower pressures, I think it's 0-15 psi which is a 1 bar sensor and even though that's not intended for doing brake pressure, that's really the style of sensor that you'd expect to see in the system. |
| 02:06 | So the other thing I want to talk about with these is how they're plumbed in so I just want to go over a little bit of the architecture and how they work. |
| 02:12 | So let's say you've got your brake pedal up here, your brake pedal's got, pushing on some master cylinder here and then, so maybe you've got your fill on the top of the master cylinder there and this has got a little piston that's pushing in here and then we've got our brake callipers so let's have our brake disc and let's say we've got our brake calliper sitting down here. |
| 02:32 | And we're going to have a hose running from one to the other. |
| 02:35 | So the pressure in this hose is the thing that we're interested in tapping into. |
| 02:39 | So there are a couple of different ways we can arrange these sensors in here. |
| 02:41 | One of the common ways is to simply put a T in here. |
| 02:46 | So we could put a little T piece in here and then we can connect our sensor here and then we can run that wire off to our data logger. |
| 02:53 | Alternatively increasingly there are actually options with master cylinders that have port dedicated for a pressure sensor so that's where we would put the amount in the sensor somewhere in the master cylinder where it's got access to the same hydraulic pressure that is in the rest of the system. |
| 03:08 | The thing I quite like about this system when they're integrated into master cylinders like that is that it's a nice tidy way, you're not adding any extra components into the system, it tends to keep the sensors out of harm's way not in a place where they're likely to get any damage or anything so that is quite a nice way to do it if you don't have sensors already and that's actually a good point to mention that a lot of road cars or a lot of OEM style cars, particularly when they've got things like ABS and stability control. |
| 03:35 | This information, this brake pressure Information is already being measured on the car and so the ability to be able to tap into something like the factory CAN bus and get that information out of the car, it means you don't have to run any extra hardware so if you've already got the pressure sensing equipment in your car and you can access it from the CAN bus, which is quite common in modern cars, then the great thing about that is you don't need to do any of this extra hardware work or buying any sensors or tapping into your brake system, anything like that. |
| 04:01 | Obviously if you're doing this you need to be really careful that you're not introducing any problems where you can have mechanical failures or hydraulic leaks because obviously that's pretty serious consequences there. |
| 04:12 | The other thing I wanted to mention before we get into talking about bias later on I want to talk about the layout of lots of factory brake systems. |
| 04:19 | So the way certainly a motorsport style brake system tends to be laid out is with, let's say this is our front axle and our rear axle, so that's the front of the car. |
| 04:33 | So we've got our master cylinders here. |
| 04:38 | Or single, whether they're single or double not really important for this point but the idea here is that, in road cars where you've got a single master cylinder you're going to have, some cars will be plumbed diagonally. |
| 04:50 | What I mean by that is there will be, one circuit will be the front left and the rear right and another circuit will be the right front and the rear left. |
| 04:59 | Now obviously they've got different pressure ratios, they've got different pressure sources out of the master cylinder but the point, the reason some manufacturers are doing this is because they want to, in the event, let's say you have a hydraulic leak, a brake line failure or something like that, say one of these hoses is gone. |
| 05:13 | If the brake pressure system was plumbed with the front and rear separately, if now one of those fronts went then you've got no front braking. |
| 05:21 | You've essentially got not front braking but if you split them in diagonally like this then at least if you have a failure in one of those diagonal circuits, you've still got one front brake left to do the braking for you. |
| 05:35 | Obviously the braking is the front axle is the one that's by far the most dominant as far as making the car stop the quickest so that's the idea behind why they're plumbed in like that. |
| 05:44 | In a motorsport context we don't do it like that. |
| 05:46 | We generally, I'll draw a separate one over here. |
| 05:49 | We generally have a separate front and a separate rear system like this and the idea here, sorry coming from 2 individual master cylinders, the idea here is that if you've got you want to be able to vary the pressure ratio between the front and the rear axle, so normally when you're modifying brake bias, you want to change the amount of braking force, distribution you've got in the front axle with respect to the rear. |
| 06:15 | If you had diagonally plumbed systems then you wouldn't be able to do that, you'd only be able to change the diagonal split not the front to rear split so this is why in a motorsport context we almost always have the axles split front to rear like that and that's certainly by far the most common thing you'll come across. |
| 06:28 | So if you are looking at making changes to your brake system or looking at plumbing brake pressure sensors in, that's just something to be aware of is taking note of how your particular car is plumbed, what that means for your situation. |
| 06:40 | So I thought, now that we've talked a little bit about the actual physical layout of them, let's jump across to my laptop screen and we'll have a little bit of a look at some data to start off with and just see exactly what it looks like, particularly for people that haven't actually seen it before. |
| 06:54 | So here at the top of the screen I've got a speed trace for a given circuit and I've got two other channels plotted here. |
| 07:03 | Now I've got the front brake pressure shown at the top and the rear brake pressure shown at the bottom so I'm just going to zoom into one particular braking zone here and we'll have a little bit more of a look in detail. |
| 07:13 | So obviously what's happening here, we've got no action or very little action on the brake pressure as we move through this section. |
| 07:19 | You can see in the speed trace, the car's still accelerating at this point on track. |
| 07:22 | And then we see a relatively steep climb in the initial brake pressure and that's happening both on the front and rear axle so in this particular situation you've got, it's a motorsport style pedal box so you've got a front and a rear master cylinder side by side, being operated by the same brake pedal so it's two completely separate hydraulic systems, one for the front and one for the rear. |
| 07:41 | So as the driver moves through the stop, so he makes more or less his biggest brake pressure will happen at the start of the stop and then he's gently bleeding off the brake pressure here, we'll talk about some of these features a little bit later on in a bit more detail but he is bleeding off the pressure before bleeding completely off and as he gets to mid corner here where the speed is minimum he's got no pressure on either of those hydraulic cylinders. |
| 08:08 | So let's just break down exactly what's going on here as far as these phases so we've got the initial hit which is this point here which is the first point we see the pressure starting ramping up. |
| 08:20 | Then this next section here is the, when we get to this point here it's really just getting to the peak pressure, so our peak brake pressure is at this point here. |
| 08:28 | So one of the things we're often interested in is the time. |
| 08:31 | So to go from here, I'm going to put a reference there, put a little second cursor there and we can read off down the bottom here, so that's 0.38 or let's say 0.4 seconds it's taking to get that driver from initially hitting the brake pedal to modulate to peak pressure and that's really one of the critical things in braking is getting to that peak pressure but not only getting to it quickly but getting to it accurately to not overshoot or undershoot your target pressure and that is definitely one of the skills that comes in with being a professional driver. |
| 08:58 | Now there are these features throughout here, these little dips in here and what I think that they will be will be throttle blips. |
| 09:06 | So let's have a look, let's add in some throttle trace in here as well, yeah so what we've got going on down there is, see these little blips in the throttle as they go, this is going down 3 years in this case. |
| 09:20 | So each, you can see these dips in the brake pressure each time, we'll see differences in the brake pressure modulation each time the driver is blipping throttle so this is where they're heel toeing the throttle on the way down. |
| 09:32 | This is a really difficult skill and this is definitely not the worst amount of brake pressure modulation but the ideal situation is you do want it to be completely smooth. |
| 09:41 | What I mean by that is if we were to take on the front here, we would ideally want that bleed to look something more like this, that's sort of our ideal default bleed profile that we want to see. |
| 09:52 | Now it's really not trivial to get it working properly, to get that heel toe going properly but in this case this probably is a little bit too much variation that we're seeing here on the brake pressure. |
| 10:03 | So the other thing I want to talk about with brake markers because this is something that we are using for analysing where people are doing their braking. |
| 10:13 | So one of the most common metrics you'll be using when you're comparing say 2 setups to each other or 2 different drivers to each other is looking at their braking markers, looking at where they're braking on track. |
| 10:22 | So what I'm going to do in this example, I've just flipped over to a different view here, I should probably explain this first, this just gives us a little bit more information about the different driver inputs. |
| 10:32 | So we've got engine speed at the top, we've got the vehicle speed here. |
| 10:35 | I've got the throttle and brakes sitting over top of each other. |
| 10:39 | In this case, I do actually have them overlaid. |
| 10:41 | I do that intentionally, I do that to save a little bit of screen real estate on my screen. |
| 10:45 | It allows me just to compress things up a little bit more by having both of those channels on the same line and because you're generally only using the brake or the accelerator not at the same time, they don't tend to overlap or cause too many problems with each other so often I have them overlaid like that. |
| 11:00 | Then we've got the brake bias shown here which I'll come back to and we'll get in a bit more detail about that in a minute. |
| 11:06 | Steering angle and the gear position. |
| 11:08 | So as I said, one of the ways you're often using brake pressure data is to understand when on track but also with how much intensity the driver is actually braking with. |
| 11:19 | So let's add an overlay in here, let's put, I'm just going to use a different lap here as an example even though this is from the same driver. |
| 11:28 | But for argument's sake, let's look at a place on track where we have a difference in the braking marker. |
| 11:33 | I can see down here, looks like there's a difference. |
| 11:36 | So here at this point on track we can see that we're accelerating down the straight then we can see in the green channel here, this is the accelerator channel, the driver is lifting off the accelerator and we see the two different brake pressure traces here. |
| 11:49 | So what I can do is again use my cursor trick, so I can just put the cursor at the point where the brake pressure starts ramping up. |
| 11:55 | In MoTeC which is what I'm using here but the process is really similar regardless of the data analysis package you're using. |
| 12:01 | All data analysis packages have the same functionality of checking for deltas or diffrences like this. |
| 12:07 | I'm going to put the second cursor on the point where the other brake marker is starting and then I come down here and look at the difference, we've got 9 m so let's say a 10 m difference between those 2 braking markers which certainly it's absolutely a pretty that's a pretty big difference. |
| 12:24 | You'd expect a professional driver to be able to brake really within 1-2 m, maybe 1-3 m depending on the part of the circuit of repeatability. |
| 12:32 | So there's probably something quite different going on in the car here, it may well be that they're braking earlier in a later run because they've got a tire issue or a tyre degradation issue, maybe they're braking for some traffic, whatever it is, but this is just really important information to understand when you're going through and doing a bit of driver training to look at where someone's actually braking on track. |
| 12:50 | Obviously, it's important like we've discussed in the past that you do need to be making sure you're looking over a distance scale rather than a time scale in the bottom. |
| 12:57 | We want to make sure we're comparing the same position on track not the same time into the lap which we've gone into a lot more detail in the past. |
| 13:04 | The other really important thing like we talked about is looking at the brake pressure itself, the actual magnitude so let's zoom into another part here where we've got a couple of different examples of the peak brake pressure. |
| 13:16 | So here in this coloured example here, the driver's using much much more peak brake pressure initially compared to the peak that they're getting in the first place. |
| 13:25 | So let's just put again a delta between them. |
| 13:29 | You can see here that we've got sorry let me just get rid of that, let's make it a bit clearer if I put it here. |
| 13:37 | So we've got 112 bar at this point and at this peak which is much later in the stop it is 86 so that's a pretty big difference in the brake pressure. |
| 13:44 | So again you can just see this is a really useful tool for understanding not just where we're braking but how hard we're braking, with how much intensity we're braking. |
| 13:51 | So this is probably one of the, certainly when you're training, well any driver really but particularly when you're training, when you're an engineer working with amateur drivers, looking at that brake pressure trace is probably one of the things you're going to be spending the most time on. |
| 14:04 | Braking tends to be the thing that people find the most difficult. |
| 14:07 | It is the most difficult thing to get right in the car. |
| 14:10 | As far as being repeatable and your brake trace being right, your style of braking, all of that stuff as well as your bravery as well as how deep you can go into the corner as needed. |
| 14:23 | All of these factors mean that looking at brake data is probably one of the most common things you'll be doing, particularly when you're working with a less expereienced driver. |
| 14:33 | So let's have a look at brake bias like I talked about before. |
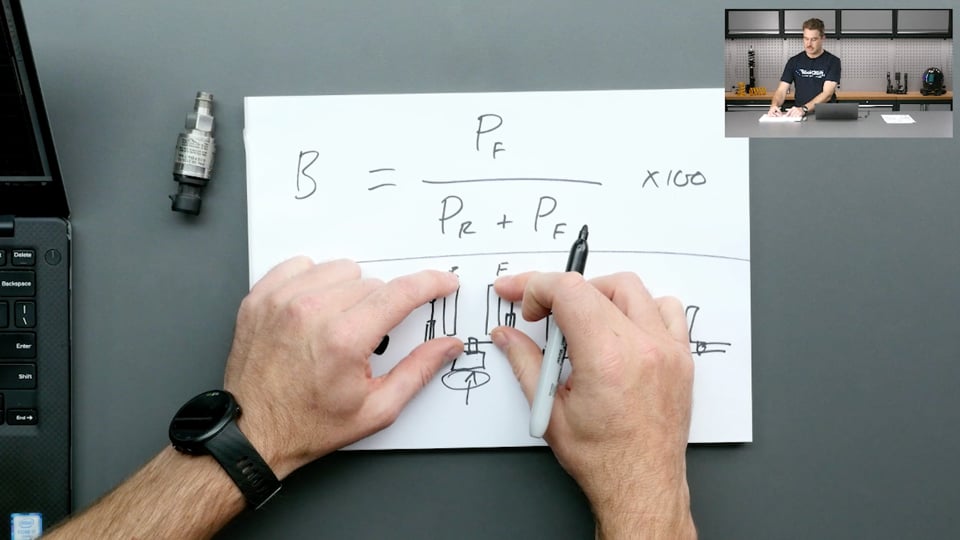
| 14:36 | So what is the definition of brake bias? It's simply the definition is simply the front pressure divided by the total pressure. |
| 14:43 | What I mean by that, we're doing a ratio calculation of how much pressure is on the front axle relative to the rest of the brake system. |
| 14:51 | So I'll just sketch out the equation for that, super super simple. |
| 14:55 | So our bias is equal to the pressure on the front axle divided by the pressure on the rear axle plus the pressure on the front axle. |
| 15:07 | So that's simply going to give us a ratio and then we can modify that by multiplying it by 100 to give us a percentage. |
| 15:14 | So that's all I'm doing over on my laptop screen here in this brake bias channel, I'm just going to get rid of the overlay just to make things a little clearer here. |
| 15:23 | Just going to put our original data on. |
| 15:26 | What I'm looking at is computing the proportion of hydraulic pressure we have on the front axle, relative to the rear throughout the stop. |
| 15:33 | So in this particular case, on this arbitrary point In the circuit, we've got 52% of the hydraulic pressure is shared on the front axle relative to the rear. |
| 15:43 | Obviously every braking setup is going to be different, that number is almost, wouldn't say arbitrary but it's only really relevant for the particular braking setup of your car. |
| 15:50 | What I mean is things like disc sizes, certainly the size of your callipers, so the piston size of your callipers and the piston bore sizes of your master cylinders, these are all going to be depending on what relative components you've got fitted to your car, this number's going to be different. |
| 16:09 | It's not necessarily going to be tied to the weight distribution or anything like that in your car, it's a reference number that we track over time and it's not something you get too carried away on but it just gives us a relative understanding of where the brake bias is adjusted to. |
| 16:21 | Now it is, brake bias is one of those things that is probably a little underrated as far as tuning the handling of your car. |
| 16:29 | So obviously as the car, as you enter a corner, the front of the car, you're transferring load from the rear of the car to the front of the car, so that means we need a higher proportion of braking effort on the frpng axle to the rear axle but depending on the position of track that you're at, so let's say you're at a high speed corner versus a low speed corner, you might want a different brake bias, if you're changing it throughout a lap. |
| 16:51 | Alternatively, if you're looking at something like a wet setup vs a dry setup you will generally have a different hydraulic brake bias from the front to rear for your dry setup vs your wet setup. |
| 17:00 | What I mean by that is in the wet setup vs the dry setup, obviously we've got less grip overall. |
| 17:06 | So that means we're not braking as hard, that means we don't have as much load transfer from the rear axle to the front so almost counter intuitively we actually end up winding the brake bias towards the rear when we have a wet setup. |
| 17:17 | So typically when people think about putting the brake bias, it's relatively intuitive, when people think about putting the brake bias to the front, if you've having entry oversteer balance or you're having problems with keeping the rear end in traction on the rear end and braking, you might move the brake bias towards the front or from the rear towards the front. |
| 17:38 | Alternatively if you are having a lot of understeer problem or particularly in the trail braking phase one of the things you can do to help rotation is to move some of your brake bias to the rear axle. |
| 17:49 | Another way to use it would be if you've got tyres burning off or you've got tyre wear going on throughout a stint, if it's wearing more at the rear than it is at the front you may have less braking capability at the rear so now you may need to move the brake bias to the front. |
| 18:03 | Alternatively you may have fuel burning off if you're doing a long race as well and that fuel burning off depending on where the fuel's distributed within your car is going to change the static weight distribution you've got in your car so you're going to need to change your brake bias to suit as well. |
| 18:17 | So all of these different reasons, these are just reasons to say that you've got, often in high end motorsport cars, well not high end but anything with adjustable brake bias, you're typically adjusting your brake bias as you go. |
| 18:30 | Certainly between tracks and in some cases as you drive around the track you'll see in some series, V8 Supercars is a great example, where you'll often see drivers making brake bias changes on the fly. |
| 18:42 | So what you'll see, maybe another example something like a prototype or a GT, typically the brake bias is just a knob which you just twist one way or the other and generally the way that's being used is making a small change to the brake bias as you go. |
| 18:53 | That's more something that you're making a change gradually, maybe a very small amount of a percentage as you click each click and this might be happening throughout a whole stint, a whole race stint as the tyres change or as the fuel burns off like I was talking before. |
| 19:07 | And something like a touring car series what you quite often have happen is a difference style of brake bias adjuster which is a quick style adjuster so you still have the ability to make tweaks throughout your stint but you might have a quick adjust that means you've got a lever, you can push it forward or back really quickly in a similar way that you've got a gear shifter. |
| 19:25 | It might be a small lever sitting somewhere, the idea there is that they can make those brake bias adjustments quickly on the fly from one corner to another so they'll have a pre defined idea of which corners they want to shift the brake bias forward and which ones they want to move it back. |
| 19:37 | Obviously that makes it pretty busy inside the cockpit, it's not something I'd recommend for a first timer, it's more of an advanced thing that you get into. |
| 19:44 | But this is some of the stuff that we use brake bias analysis for. |
| 19:47 | Maybe I should just talk a little bit about how the brake bias is actually adjusted and why we're measuring a pressure difference as well so I'll just sketch out exactly what's going on there. |
| 19:55 | So if we're looking from the top view here, so let's say we've got our master cylinders and if we took it from the top view of the pedal box I should say. |
| 20:03 | So let's say, this is at the top of our brake pedal so this would be the driver's foot would be sitting on here, pressing the brake pedal in towards the master cylinder, so you've got these little levers sticking out with a bias bar set up in here. |
| 20:15 | So the idea here is that the brake pedal is pushing on this trunion, this bias bar and both this whole bar is distributing the force to both front master cylinders. |
| 20:28 | And basically the position of that trunion with respect to the master cylinders is going to depend how much of the mechanical force, what proportion of that mechanical force is going to be transmitted to the front master cylinder, versus the rear master cylinder. |
| 20:39 | So let's say that's the front and that's the rear master cylinder. |
| 20:41 | Just zooming in on that a little bit, what I'm saying is if that's your bias bar and this is the connection to the master cylinders here, if we're going to move this trunion is essentially on, normally it's on a type of thread and there's usually a mechanism to connect to the bias bar here which is what that knob's connected to which is essentially rolling that trunion bar. |
| 21:04 | The idea here is that as this connection between the brake pedal and the trunion bar moves along, so as it moves left to right, if you move it more towards the front you're going to have more of that mechanical force being proportioned to the front hydraulic system and if you move it to the left, you're going to have more on the rear hydraulic system. |
| 21:25 | So that's just a little bit about how that bias bar adjustment's actually working in there as well. |
| 21:30 | I'll show you how we're calculating that, so if I can just come in here to brake bias and we'll go to edit the maths for that. |
| 21:38 | So just ignore the first part of this math channel for the start but you can see the second part where it's implemented exactly the equation I wrote on the overhead before which is, we've got the front axle here, so this is front brake pressure divided by the front plus the rear added together. |
| 21:56 | There is actually one other part I want to dig into with that. |
| 22:01 | I've got this condition here, so in MoTeC syntax the way they deal with, what I want to do is get rid of the sections in between the braking zones so let me just go back one step before I explain that. |
| 22:16 | So you'll see here, I've got the bias only being computed in areas where we are braking so any time there's hydraulic brake pressure here is where we are computing the bias and everywhere else I've got a blank value. |
| 22:26 | Now you could show it as zero when you're not braking, myself I find that a little bit cluttered, I like to make the plots as clean and as easy as possible to read so I'll show you how I've got that implemented in here. |
| 22:37 | It's using a choose statement. |
| 22:38 | All this is saying is we've got 3 parts to this statement, the syntax is choose, all it means is basically a conditional so it's saying when we're braking, so if braking condition equals 1, that's a boolean operator that's just saying when 1 that means it's equal to, that means it's happening. |
| 22:53 | So when we're braking, do this calculation and we've got a comma here, otherwise invalid. |
| 22:56 | Invalid jut means nothing, give me nothing. |
| 22:59 | So show no value, don't do that computation for me. |
| 23:02 | This braking condition is simply a condition that I put in there to define whether the car is braking or not, the idea here is that I can write a condition that I can use in one place and I can use that is braking condition throughout my analysis project, don't need to keep, for example I could implement the same thing here by just saying when brake pressure is greater than 5 bar for argument's sake, do this calculation. |
| 23:28 | The problem is in lots of different math channels I'm going to be wanting to use that is braking condition and it means that you can end up with inconsistent ways it's calculated throughout your project. |
| 23:36 | If you go and update it, you have to go manually and update all of your different math channels, that's why I tend to define our single is braking condition that I can modify in a separate place and I can update it, I'll actually show you guys what that looks like. |
| 23:47 | So is braking, let's have a look at the example for this. |
| 23:54 | So in this case it's using another choose statement and all this reads is it says that when the front brake pressure is greater than 50 or 50 psi, give me a one, otherwise give me a zero. |
| 24:05 | So then you can see obviously when we're braking we're going to get a 1. |
| 24:08 | So we can now go back into our original statement. |
| 24:11 | So that's doing a test to say is braking condition, if it's equal to 1 then do the calculation. |
| 24:18 | So that's how that's working for us. |
| 24:20 | That's my preference, you don't have to use a conditional like that, I just find it makes it a lot cleaner of a way to use. |
| 24:27 | Obviously as I talked about before, the way I'm using this channel is to understand how the driver is changing the bias throughout a lap but also throughout a stint as well so I'm only looking at a relatively short run here but if you're looking at it throughout a race stint you would see this value evolve as well. |
| 24:43 | Now what we can see is if we zoom into one of these particular sections here, we can see there's a lot more variation in the bias as we get towards the lower pressures. |
| 24:52 | And we'll look at another type of plot later which is another way to visualise this but essentially what's going on here, at the heavier ends of the brake pressure spectrum the bias does tend to be more constant. |
| 25:02 | At the lighter ends you can see where the brake pressure's dropping off here. |
| 25:05 | That's where you'll get more of that, more stiction more, any sort of hold ups you've got in the whole brake bias setup so there's a lot of different joints in the pedal box. |
| 25:17 | What I mean by that is there's a whole lot of different bushings and bearings and as you get lighter and lighter pressure it means the friction in each one of those different systems tends to hold up one side of the master cylinder more than the other. |
| 25:29 | So whether it can be any of the connections, any of those bearings or bushes causing that problem, it also can be different amounts of stiction you get within the bores of the master cylinders themselves even. |
| 25:41 | It'll just depend on your exact system where those bias variations are coming in. |
| 25:47 | Now you are always, it's natural to get more bias variation on low pressures which is you're going to see predominantly more at brake pressure release than you see during the main braking event but it's also important to realise that in some cases people actually use this to their advantage as far as having different mechanisms in their pedal box to actual bias their brake pressure towards the rear axle on brake pressure release. |
| 26:10 | So the idea here is that on brake pressure application the bias is exactly what you set it based on your adjuster but the whole system is pre determined to set up that when you start only on the release direction of the pedal that essentially you end up adding a little bit of extra pressure to the rear axle relative to the front that you didn't have before. |
| 26:31 | The idea here is that it helps, adds a little bit of dynamic rear brake bias just on corner, when you're releasing the brakes, obviously when you're releasing the brakes this is the position, this is the time when you start to rotate the car into the corner. |
| 26:42 | So for some cars that can be a big advantage, some advantage when you add some rear bias to the car on corner entry if you're struggling with understeer in the first place. |
| 26:52 | So this is again that I would come to look at how much that system was working. |
| 26:57 | Typically those systems are quite adjustable so you can adjust to anywhere from having no effect through to having quite heavy effect. |
| 27:03 | Whether it's a linear or a non linear effect depending on the system that you're using. |
| 27:07 | This is one of the places that you could come and visualise that by looking at the brake bias channel as well. |
| 27:13 | The other thing I want to talk about here is the fact that I'm looking at, this page here is sort of my typical driver analysis page. |
| 27:22 | This is the sort of information I'd be using when I was looking at the way the driver was driving the car so I've got the steering, the brake, the accelerator and obviously the gears as well. |
| 27:32 | You'll see here this channel that I'm actually plotting for the brake pressure is brake pressure total so I'll just show you what the definition of that is. |
| 27:38 | That is just a summation of the front and the rear brake pressure. |
| 27:43 | The reason I do that is because what you'll quite often find is different drivers running a different brake bias from one to the other. |
| 27:50 | So the way you'll see that is again I'm just looking at one single driver here so it won't show up too well but when I've got an overlay here you'll have an offset of 2 drivers doing 2 quite different brake biases. |
| 28:03 | This white line would be at a different point with respect to the yellow line. |
| 28:06 | The advantage in looking at the brake pressure total is it makes the braking signal less sensitive to the bias. |
| 28:14 | So let's say, what I mean by that, let's say we've got 2 drivers with quite a different bias, let's say you've got a pro am situation where the pro is much more comfortable with a more rearward bias and the amateur is more comfortable with a more front bias because they find it gives them more stability on corner entry. |
| 28:28 | Now if I was to just plot the front brake pressure for both of those when I was doing the driver analysis, that could skew me because we've got a different brake bias setting it might lead me down the garden path as far as making me think that one driver was pressing harder on the pedal than the other so that's why I always use the total brake pressure. |
| 28:47 | It just gives me a little bit more of an equal way, it basically takes the bias mostly out of the equation as far as how much brake pressure effort is being used. |
| 28:55 | So guys, that's it for the most part of the demonstration. |
| 28:59 | I have got a couple more things to go through in a second here but if you've got any questions about any of this, whether it's about data analysis, braking systems, anything else that comes to your mind, any of our future courses, anything you're welcome to chuck those in the chat and I'll get onto those soon. |
| 29:13 | The last couple of plots I wanted to go through was adding in a couple more sensor types. |
| 29:18 | Everything we've talked about so far has been with brake pressure sensors. |
| 29:23 | So how much actual hydraulic pressure we've got in each one of the lines, each one of the hydraulic lines. |
| 29:29 | There's also another type of sensor that you can use which is quite commonly used in pedal boxes which is brake position. |
| 29:34 | So that's measuring, or more specifically the position of the master cylinder so how far each master cylinder is moving and with that position and along with the pressure data we can start to do some quite useful and interesting stuff as far as diagnosing problems within our braking system. |
| 29:48 | So what I mean by that is if we just come across to the overhead again. |
| 29:51 | Back to our setup where we've got these 2 different master cylinders, what I mean by that is essentially the way it works is usually you're just having a little linear potentiometer on each side, on each master cylinder and the idea here is that not only are we measuring the hydraulic pressure in the hoses, we're also measuring how far each one of these master cylinders are actually moving. |
| 30:16 | So I've got a couple of, I've got some data here to show you from the same car that we've been looking at. |
| 30:20 | So here I've got again, this is just a speed channel at the top. |
| 30:23 | I've got our brake master cylinder travel for both the front nd the rear and then our same brake pressure channels that we were looking at before. |
| 30:30 | Just here I've got them overlaid on top of each other but it's exactly the same data that we were looking at before. |
| 30:34 | So what's interesting to look at is we look at this straight away is even though the pressure ratio which is what we see at the bottom here, when we overlay the front and rear pressures actually relatively similar to each other. |
| 30:45 | As we saw in the brake bias number, that was roughly 52% at the stop we looked at before so that kind of makes sense. |
| 30:52 | But interestingly if we look at the brake master cylinder travel, the front travel has got a lot more than the rear travel. |
| 30:59 | So we've got, let's say here, 11 mm on the front and 6 on the rear so almost double the amount of travel. |
| 31:04 | So that means that the bias bar is going to be skewing quite a lot as the brake pedal goes in and that is actually an important point that we'll be getting to in a future course on braking system design is on the setup of that bias bar, what you typically want is the bias bar to be flat when you've got peak brake pressure on. |
| 31:23 | So that means you end up having to put some sort of offset into the bias bar to allow for the different amounts of travel you're going to get on the front and rear axle. |
| 31:30 | So straight away that's a pretty interesting thing. |
| 31:33 | The other interesting thing that we see here and we tend to see it more clearly or in some situations you see it more clearly on the position channel rather than that pressure channel is vibrations in your braking system. |
| 31:44 | So in this particular car, this situation where there was some vibration on the rear axle. |
| 31:50 | And you can see that's what these little spikes are here, these little relatively high frequency spikes as we move down the position channel. |
| 31:56 | Now you can see some, you definitely can see some of this behaviour in the pressure signal. |
| 31:59 | Because the pressure signal just doesn't tend to show up as cleanly on the position and what that's going to mean is that that's something that the driver will actually feel coming back through their foot because you're seeing there on the position. |
| 32:11 | Anything you see on that position channel should correlate pretty well with the feedback the driver's getting through the pedal because they'll actually feel in this case where we had a rear brake vibration the actual pedal will actually start vibrating a little bit. |
| 32:25 | If you do have a brake vibration which can happen when you end up with warped pads or sometimes if you get pickup on the discs, sorry warped discs or you can get pickup on the discs during a pitstop or something like that. |
| 32:37 | From brake material fusing itself onto it. |
| 32:40 | This is the sort of thing you'll have and in this particular case we can see really clearly that's a rear brake problem and not a front brake problem so that's one interesting use for using the brake travel. |
| 32:51 | The other is to look at it in terms of stiffness so here I've got a couple of different plots, I've got a speed plot at the top here, we can see, we're just looking at this single braking area here, I'll just zoom over this single zone and you can see here I've got two XY plots and they're zoom linked so they're only looking at the positions on track that I'm zoomed to so let's just zoom in back there again. |
| 33:13 | So what I'm plotting here in these XY plots is I've got brake master cylinder travel on the vertical axis and pressure on the horizontal axis. |
| 33:22 | So this is a similar way to what we were looking at before but looking on an XY plot rather than a time distance plot. |
| 33:28 | It's the same information. |
| 33:30 | The idea here is that the angle of this line is indicating something about our compliance or our stiffness in the system so that's telling us how much travel we're having to use on the pedal or how much travel we're having to use on the master cylinders for how much pressure output we're getting. |
| 33:46 | So this can be a really useful way of overlaying 2 different sets of data to understand if you've got a brake compliance issue. |
| 33:51 | So this is where something like a mechanical, if you've got a mechanical compliance issue would show up or if you've got brakes that need to be bled because you've ended up with air inside the system. |
| 34:02 | If you were to overlay one run where you know the brakes are good versus the one you've got now, if you were to see a difference in the trend or the angle of that line, that's going to tell you something different about the stiffness. |
| 34:12 | So again that's just a nice diagnosing feature, this is something that I usually, when I have a car that is running brake travel sensors this is usually one of the sensors I have up on my telemetry that I'm looking at live just to understand if there's anything changing with the brakes over time because it can be a really nice test. |
| 34:28 | The last piece of data I want to look at here, I'm just going to zoom out over a whole lap is, we're plotting here brake bias versus the total brake pressure. |
| 34:36 | So you can sort of see this trend here, if I just try and draw this as cleanly as I can with the mouse. |
| 34:44 | I've got one there and sort of another one like this sort of this funnel shape here. |
| 34:48 | And the idea here is that again it's just giving us a way of looking at how much our brake bias is changing as we change the pressure, as a function of the pressure only. |
| 34:57 | So obviously it's important that we're not adjusting the brake bias when we're looking at this but what we want to know is we can use this to understand how much compliance and how well our brake system is working. |
| 35:11 | As I said before, if you're not adjusting your brake bias throughout a lap, you want your brake bias to be as consistent as possible. |
| 35:17 | Inconsistent brake bias, different proportion between the front and the rear axle is going to give you potentially quite nasty handling traits. |
| 35:24 | It'll make you start hunting down things in the car setup, whether it's suspension or tyre pressures, stuff like this, when it can just be a brake bias problem that's hurting you the whole time and you didn't even realise. |
| 35:37 | So what I mean by this is again this can be a useful plot to overlay from one brake system to another but essentially we see something really similar than what we saw in the log data which is at low brake pressures we get a much bigger bias variation and at high pressures we get a much lower bias variation. |
| 35:54 | So ideally we want this spread of data in the middle there to be as narrow as possible. |
| 36:01 | You want that funnel to be as narrow as possible particularly in the higher end. |
| 36:04 | As I said before, compliance in the system will tend to mean you end up with some, not compliance, different stiffnesses in the joints in the suspension mean you end up with a different spread of data at this end of the plot but up here you really want this to be as tight as possible together. |
| 36:19 | That's going to be different for every car, every situation but again it's just another nice overlay to understand if you've got different compliance issues or changing brake bias with brake pressure because generally it's not something you want unless you've designed it in there intentionally. |
| 36:33 | OK guys that's it for the lesson today, I just want to remind you guys about new courses that are coming out, everything we've gone through today has got particular relevance to our brand new course which is our Professional Motorsport Data Analysis course. |
| 36:46 | If you're interested in that, absolutely go and check it out. |
| 36:49 | And if you remember, if you're not watching this live, not watching this webinar live you can go back and check in our archive all of our old webinars go into our archive and if you've got any questions that come up out of this you're welcome to ask in the forum and I'll get to them there. |
| 37:08 | But for now, let's jump across to the questions and I'll see if anyone has had any questions as we've moved throughout the webinar. |
| 37:15 | OK questions from Shane Plohl, OptimumG released a technical article with methods for calculating a value to compare how aggressive you apply and how smooth you release the brake, have you used anything similar and did you find it useful? Actually funnily enough I have used something similar, I actually used to work for that company back in the day so I know exactly what you're talking about. |
| 37:32 | Essentially what you're doing is using, OK let's start with your brake aggression. |
| 37:38 | So let me sketch that out for you, what I mean by that. |
| 37:44 | So let's say this is our brake trace here, got it ramping up and then fading off into nothing here. |
| 37:52 | So with brake aggression what we want to look at is the slope of this line and that's how quickly we're ramping up that pressure. |
| 38:01 | So essentially what we want to do is a rise over run calculation of that to look at the gradient or M as you might remember it from maths if you're doing rise over run. |
| 38:13 | So what we want to do, there's a couple of different ways you can implement that. |
| 38:17 | You can, the main way we want to do it is we want to take the derivative of it but we want to first use a derivative to check that the brake is being applied not released. |
| 38:27 | So what I mean by that is we only, we want to do the brake aggression for the implication aggression anyway, we only want to look at this section here where the brake pressure is actually increasing. |
| 38:42 | And the way we do that is by looking at the derivative so looking at the slope of it which is something that's, a tool that's built into pretty much every data analysis package, it's something I've gone through in previous examples, it's something we go through in quite a lot of detail in the professional motorsport data analysis course but essentially what the software is actually doing is if I was to bring this down to the actual points that this is looking at. |
| 39:07 | Essentially between each one of these points it's taking the slope between each one of them. |
| 39:12 | Now what's different you'll see is that when we're applying the brakes as opposed to when we're releasing the brakes, is that each one of these little slopes has positive. |
| 39:22 | It's going in this direction when we're applying and it's going negative, it's going in this direction when we're releasing the brake. |
| 39:29 | So with the brake aggression we only want to calculate it when we're applying it so for a start we say only calculate when the derivative is positive. |
| 39:35 | That's great, the next thing we want to do is we want to take the derivative or the average slope of this line as well. |
| 39:41 | We don't have to take the average, there's all sorts of different ways you can calculate it but one of the first things I do normally is that you'll see the brake pressure data is usually actually quite, it's usually got some messiness to it. |
| 39:52 | The problem with that messiness is it does tend to stuff up the derivative calculation because when it's doing these little slope calculations up here, if you've got very messy data like this, these slope calculations can be going, they're doing crazy like that so what you first usually want to do to that signal is smooth it. |
| 40:07 | So if you've got a signal like that you find a smoothing function that finds a line that traces the trend of what's going on but we're missing all that high frequency detail, that's really what we want to ignore for the derivative calculation. |
| 40:20 | Then after that you can do the derivative on the smooth. |
| 40:24 | So first were taking the derivative to say only calculate the aggression when we're increasing the brake, then we'd do smoothing the channel and then we're taking the derivative of that channel. |
| 40:33 | After that, you can do things like looking at either the maximum or the average of that channel across a lap. |
| 40:40 | Then you can plot that across a whole lot of different laps and look for a trend in the aggression. |
| 40:46 | Whether it's a trend, the difference in the trend between aggression between one driver or another or a difference between as the run changes there's all sorts of different ways you can check that. |
| 40:56 | You also asked a question about smoothness. |
| 40:58 | It's a similar, it's got some similar stuff in there so brake pressure smoothness, what that means, if we look at the same, similar plot to before. |
| 41:06 | But let's say our real brake signal looks like this. |
| 41:13 | We want to quantify basically how unsteady that signal is. |
| 41:18 | Particularly on release but doesn't matter, the application, it's the same concept. |
| 41:23 | So what we want to do here is, the method for coming up with a number of how basically spikey or how unsteady the signal is, what we want to do is again you probably guessed it, we're going to use the smooth function. |
| 41:34 | So we're going to calculate the smoothed version of this with a sort of moving average filter and you want to do something that again you're finding that visually you've sort of got to experiment with a different time period over which you're using that moving average filter but you want to find a moving average filter which again calculates the guts of that shape as closely as you can to that shape while you're getting rid of that high frequency noise. |
| 41:58 | Then after that we're writing a math channel at each time step that we're calculating this for we want to find the difference between each one of these channels so obviously you've got, each one of these is actually a discreet time step that you're measuring it at so each one of these time steps you're going to take the vertical difference and you're looking for the absolute value because you don't care whether it's above or below the smooth line, you care about whether there's a difference so you'll be looking at this one, this one, this one, this one, this one, this one, this one. |
| 42:23 | And each, the idea here is that you sum up the amount of difference over a lap and then the difference between those things, between the smooth and the non smooth is giving you a smoothness calculation on your brake pressure. |
| 42:36 | And both of those techniques, both in terms of looking at derivatives and looking at smoothness are applicable to lots of different parts of the data analysis, not just, definitely not just braking, you can use those all over the place. |
| 42:49 | So that's, they're good question. |
| 42:51 | Did I find it useful, yeah definitely, absolutely. |
| 42:53 | It's a way that you can basically put a metric on things without having to dig down in the nitty gritty of the data. |
| 43:00 | You can make a report really quickly just looking at these, they're often termed KPIs or key peformance indicators. |
| 43:08 | The idea is it's giving you some sort of zoomed out metric across the entire race or a run or whatever it is, you can just look at these metrics and very quickly learn a lot about the way the car's been driven, the way it's behaving just by looking at these metrics rather than having to go through line by line squiggly line and actually compare the way it's been driven. |
| 43:26 | Typically what you're doing is you're using these metrics to point you into things in the data that are actually interesting rather than going through the data line by line which is really really time intensive and not particularly good use of your time either. |
| 43:38 | OK question from Mike N, Mike asks, does the data analysis course go into some depth regarding math channels and creating math channels? Yeah absolutely so we've got 2 courses just to be clear, we've got our data analysis fundamentals course and the second course we've just released is the professional motorsport data analysis course. |
| 43:57 | So both of those courses, they're sort of designed to go together depending on your level, depending on how experienced you are with this. |
| 44:03 | If you're already well versed, you're already using, making quite a lot of use of motorsport data analysis. |
| 44:09 | May well be that you don't need to take the fundamentals class and you can go straight to the professional level course. |
| 44:16 | Although I would say if you're not sure, probably start with the fundamentals and then move onto the professional course. |
| 44:21 | In saying all that, the professional course is the one that dives into a lot of detail about math channels, looking at why we use them, different methods, whether it's trig functions or calculus functions or all sorts of different ways you can link things together and set them out, yeah it does go into quite a lot of detail on that and certainly, I think we actually do some, I'm sure we do some details exactly along the lines of the question Shane was asking around derivative and smoothness calculations as well. |
| 44:51 | So yeah happy to answer any more specific questions for something specific you're looking for in motorsport data analysis but there is quite, it is quite in depth and if you actually head across to the website and have a look through the curriculum you'll see a little bit more information about what exactly we cover as far as math channels. |
| 45:06 | OK Max asks, is there a good way to flag over travel in telemetry caused by leaks or brake failure before they have that oh shit moment of realising they have no brakes? Yeah so unfortunately the same, yes you can, is the short answer but the problem is at the same time that they're going to have that oh shit moment where they're going to press the brake pedal and it's going to be too long and they're not going to work or the pedal's just going to be a lot longer than they expected, you're going to have no time to warn them over the radio anyway so unfortunately for that particular situation it's not going to be particularly useful. |
| 45:41 | What I would say is what we looked at towards the end of the lesson I did where I was talking about using brake travel vs brake pressure, if you're tracking that as a metric throughout the race, as I said the slope of that line, if it's something that's slowly slowly changing over the race, let's say you've slowly got brake fluid boiling and you're introducing more air into the system you know that the brake stiffness is going to be getting lower and lower so that slope of that line's going to be getting lower and lower. |
| 46:05 | If that's something you're tracking, you can go ahead, either look at it manually or you can put some metrics on it and track it over time. |
| 46:11 | But apart from that if it's going to happen instantaneously it's probably not going to be too useful for you. |
| 46:17 | But yeah that's all the questions we've got guys. |
| 46:19 | That was some really great questions, thanks very much for putting those through, I think they were really useful to have in there and obviously you guys are really thinking about this stuff in depth already which is fantastic. |
| 46:29 | So guys that's all we've got, I hope to see you guys around the forums, if there's anything more that comes up based on this, feel free to jump in the forums and ask your questions there and I'm sure we can dig into a lot more of this analysis chat. |
| 46:42 | Thanks very much guys, see you next time. |
Timestamps
0:00 - Why do we use brake pressure sensors?
1:15 - Sensor overview
2:05 - Sensor plumbing
4:10 - Factory brake system layout
6:40 - Brake data overview
10:00 - Brake markers
14:30 - What is brake bias?
19:45 - Brake bias adjustment?
21:30 - Brake bias calculation
27:10 - Using total brake pressure for overlays
29:10 - Brake position
37:15 - Questions